As discussed in the Misunderstood Metrics article, a good measure for success of your web content is ‘user engagement time per user’. That number requires a calculation of the standard metrics User engagement / Total users. Here is how to create that calculated metric in Google Analytics 4 so you can easily include it in your reports. More
Search Results for: google analytics 4
function: Google Analytics 4 Report
 The GA 4 Reports wizard of the Google Analytics connector allows you to get a custom report for your GA property. More
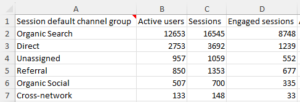
article: Google Analytics 4: Add Session Count Dimension
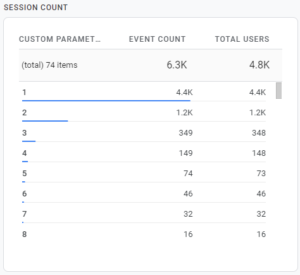 It is easy to get a Session Count fields added to your Google Analytics 4 reports — just add a custom dimension for the existing event parameter! The data doesn’t start collecting until you do this, so do it now! More
article: Google Analytics 4: Add Session ID And Other Custom Dimensions
Did you know you could report on individual sessions in Google Analytics 4? You just need to add the Session ID dimension to your report. Before you can do that, you need to create the Custom Dimension to capture it — the event parameter already exists! More
article: Google Analytics 4: Adding Page Count
 There are a lot of things from Google Analytics (Universal Analytics) that I miss in Google Analytics 4. Although page engagement metrics are much improved, I was frustrated by the lack of any ability to gauge the Page Depth of my visitors. Do they look at 1 page, 3 pages, or 20? The averages just don’t tell the whole story. Here is how I added a Page Count dimension and a couple of early observations I made with the data. More
report: Google Analytics 4: User Engagement Analysis
 This free Excel report works with the Analytics Add-in for Excel and Google Analytics connector to summarize the user engagement of your top website pages. More
article: Google Analytics 4 Report Automation
Now that the Google Analytics Data API has been released, it is possible to automate your Google Analaytics 4 reporting. Analytics Edge and the Google Analytics connector makes the process easy with a powerful add-in for Microsoft Excel.
article: Reading Google Analytics 4 Detail From Big Query
If you have already setup Big Query linking from Google Analytics 4, here are the steps you need to get that detailed data into Excel via Analytics Edge…simplified. More
article: Google Analytics 4: Building the Google Analytics Traffic Dashboard
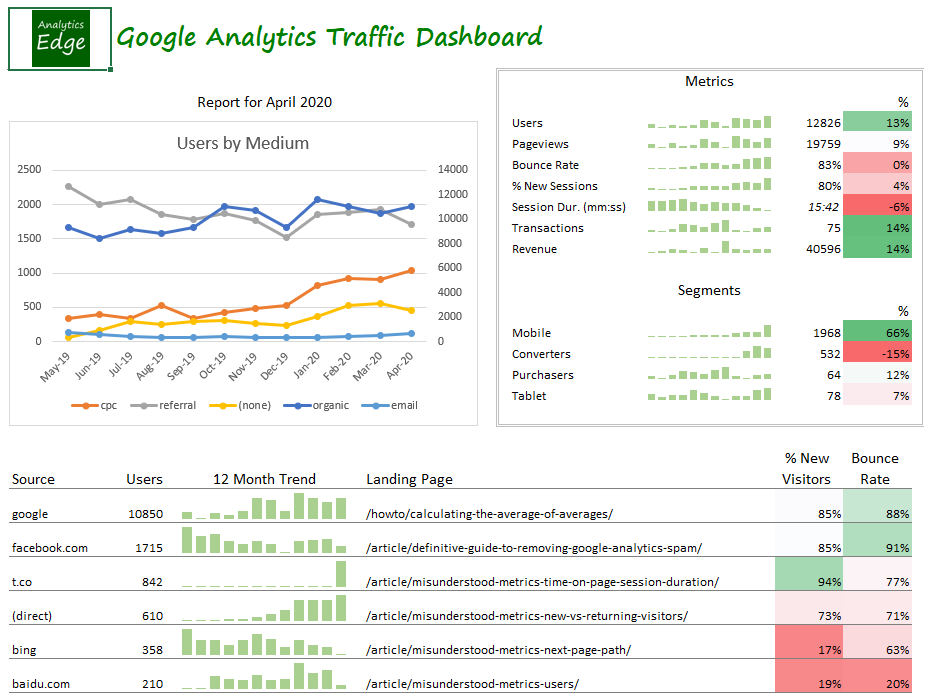 This article describes the steps taken to build the Google Analytics 4 Traffic Dashboard report with the Analytics Edge Add-in for Excel. It follows the approach described in the article Building a Marketing Dashboard in Excel. More
report: Google Analytics 4: Traffic Dashboard
This free workbook provides a quick summary of your website traffic over the past year, highlighting key changes last month. More
article: Multi-View Google Analytics 4 Queries
The Analytics Edge connector for Google Analytics supports multiple property queries when used in combination with the Analytics Edge Add-in. More
article: Combining Google Search Console And Google Analytics Data
Easily combine data from Google Search Console with Google Analytics 4 — Analytics Edge makes it easy.
- no copy-paste
- no downloading data
- pulls data direct from API’s
- no coding required
- no 1000-row limit
- less than 5 minute’s work
- the whole workflow automated
- click to refresh
article: Misunderstood Metrics: GA 4 Time on Page / Session Duration
Time on page and session duration are old metrics from the early days of web analytics. You can find the equivalent in Google Analytics 4, but I don’t recommend using them as they are fundamentally flawed as explained below. User engagement is what you should be focusing on in today’s web metrics, so User engagement/Total users is the preferred measure.
Add this calculated metric to your property so you can include it in your reports.
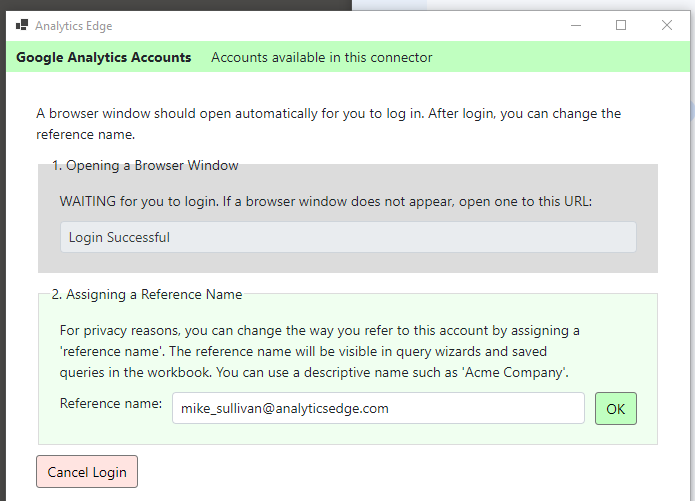
function: Accounts – Google Analytics
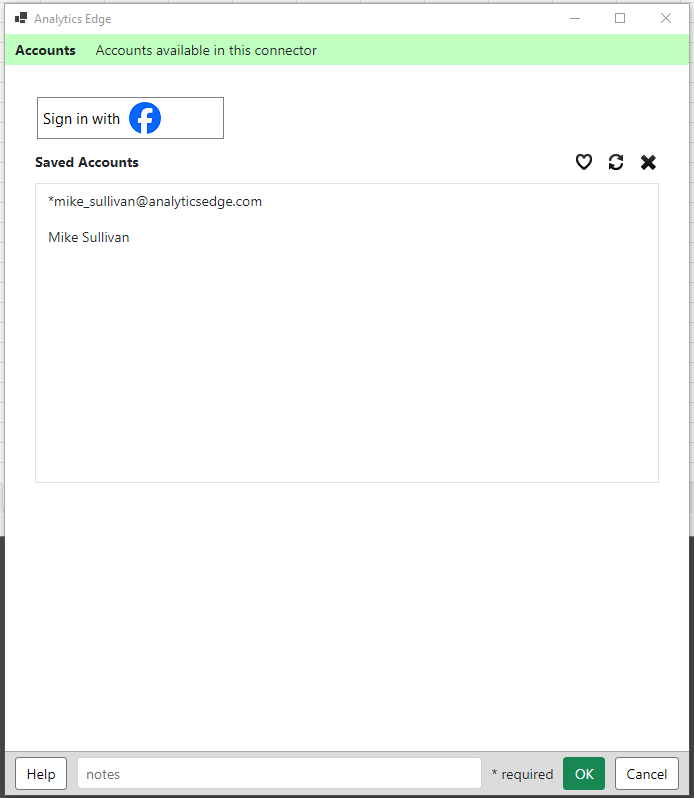
 The Accounts wizard is used to manage saved Google Analytics accounts for use by the connector. For security reasons, Analytics Edge stores your account information in an encrypted file on your computer, not in the workbook. Accounts are stored using Reference names, and the queries in your workbooks use a Reference name to identify which account to use. More
function: Accounts – Google Business Profile
 The Accounts wizard is used to manage saved Google Business Profile accounts for use by the connector. For security reasons, Analytics Edge stores your account information in an encrypted file on your computer, not in the workbook. Accounts are stored using Reference names, and the queries in your workbooks use a Reference name to identify which account to use. More
function: Accounts – Google BigQuery
 For security reasons, Analytics Edge stores your account information on your computer, not in the workbooks. Accounts are stored using Reference names, and the queries use a Reference name to identify which account to use. More
function: GA4 Realtime Report
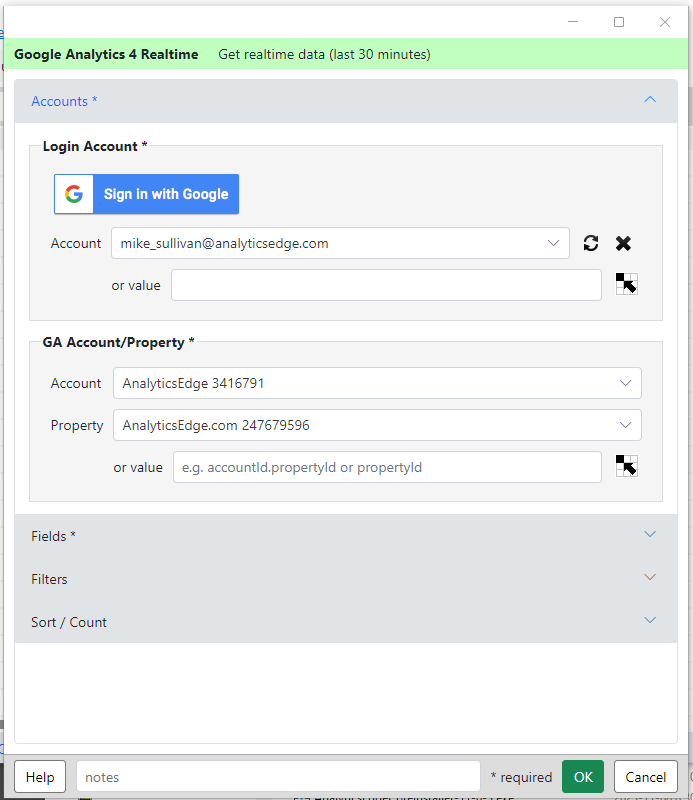 Download your data for a GA4 Realtime report. This wizard lets you select an account and GA4 property. select the fields, filters and sort criteria for the report.
GA4 Realtime reports show traffic in the last 30 minutes.
function: Read Google Sheet
 This Analytics Edge wizard is used to read the data from a Google Sheets worksheet. It always reads the entire sheet. More
function: Write To Google Sheet
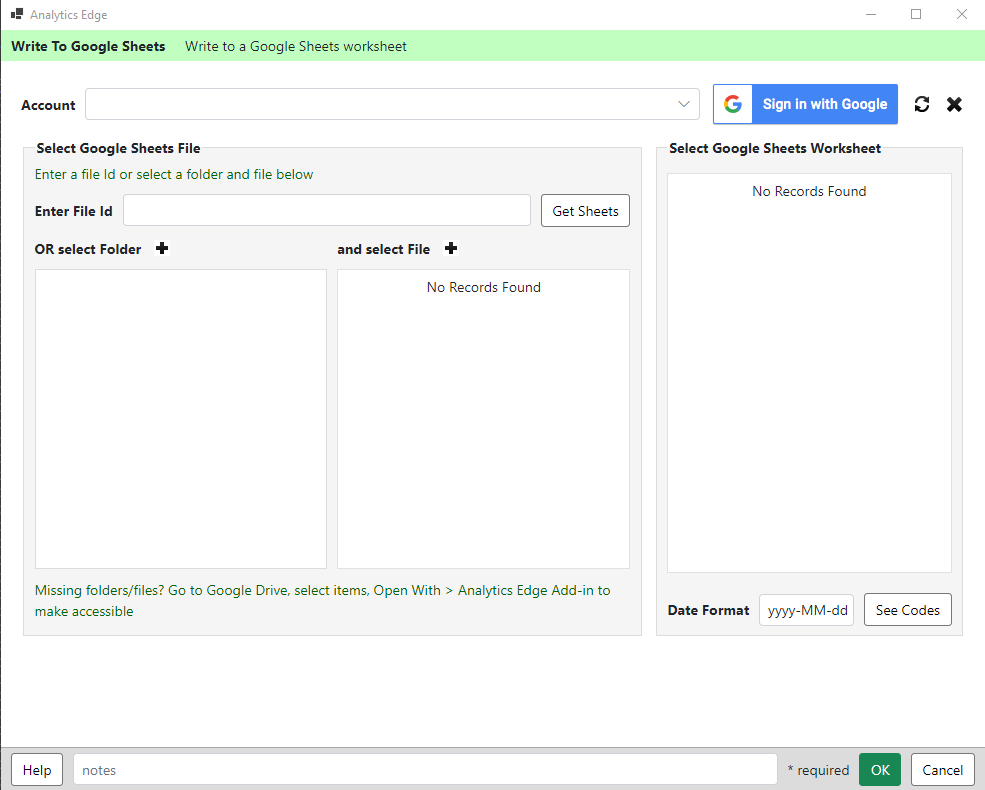 This Analytics Edge wizard is used to write the results of an analysis to a Google Sheets worksheet. It always overwrites the entire sheet. It can can be added as a separate macro function, or as an option from the Write to Worksheet wizard. More
article: Google Search: Bulk URL Index Inspection Queries
 if you manage a large number of Search Console accounts and sites, this workbook will help you cope 2 big hurdles: the 2000-URL per day limit, and aligning which account to use for each URL. More
function: Url Inspection – Google Search
Get one or more Url Inspection results from the Google Search API [limited to 2000 per day per site]. More
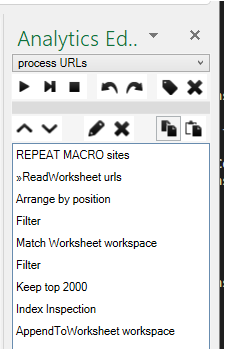
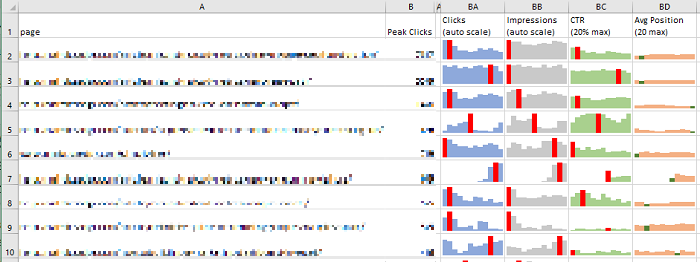
article: Building a Google Search Report: Macro Capabilities
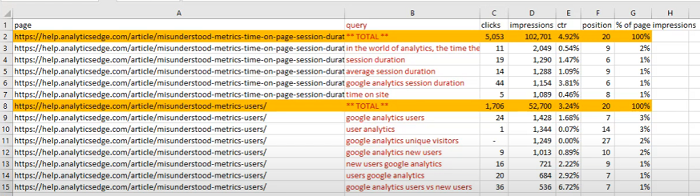 This article explains what is possible using the Analytics Edge macro capabilities. It pulls in Google Search data for your website pages and produces a report showing the totals and top queries for your popular pages. More
article: Google PageSpeed Insights API: No Connector Required
Google’s PageSpeed Insights API reports on the performance of a page on both mobile and desktop devices, and provides suggestions on how that page may be improved. The service works with a simple URL request and requires only a static API key for volume use. The Read Text/Web File function in the Analytics Edge Add-in lets you make these types of web queries — no need for a special connector.
More
report: Google Search: Data Skeptic
Inspired by work provided by Britney Muller (and Masaki Okazawa) at Mozcon21 (bit.ly/mozcon-21), this workbook provides an excellent SEO analysis highlighting keyword cannibalization, performance changes and top page categories.

function: Ads Reports – Google Ads
 The Ads Reports wizard of the Google Ads connector is used to report the performance of your Google campaigns and ads.
More
article: Misunderstood Metrics: GA 4 Sessions
As people dig into the metrics in Google Analytics 4 for website tracking, they discover that the session counts can sometimes be confusing. My recommendation: stop focusing on sessions — focus on user engagement with your content instead. The number of sessions in a day has become almost meaningless, and that metric should not appear in a prominent location in any report. More
error: 400 Selected dimensions and metrics cannot be queried together
This API error indicates that the metrics and dimensions being requested cannot be used together. This usually happens when you are creating a custom report, and you added a combination of fields that the API rejects. More
article: Google Search: Eliminating Noise
As discussed in a companion blog article, while trying to create an annual report for my own websites, I discovered that Google Search data is full of ‘noise’ — data that actually makes it harder to make useful observations about trends. This article includes the workbook I used.
article: Google Search: Annual Reporting
Long-term reporting with Google Search Console data is fraught with challenges. This article discusses some of the unique problems time can create, and how Analytics Edge products can save you time while solving them. More
article: Error: 403 User does not have sufficient permissions for this profile
This Google Analytics API error indicates that the account you are using cannot access the Google Analytics view (profile). This usually happens when the Google Analytics account owner removes your access (a typical agency problem). More
article: Error: 401 authError Authorization
This Google Analytics API error indicates that the security token for the account you are using has failed. Normally the security tokens are auto-renewed, but if you changed the account password or otherwise changed your security settings, the renewal can also fail. More
article: Misunderstood Metrics: GA 4 New vs Returning Users
Confused by the new and returning users metrics in Google Analytics 4? Did you know that the “Returning Users” number in the online reports could be wrong? No wonder you were confused…
More
report: Google Search: Branded/Non-Branded Report
 In this one report, see the impressions and number of unique keywords, by month, for branded and non-branded searches, split into 4 search engine ranking groups: More
article: Google Search: Branded vs Non-Branded for Large Sites
If you manage several large websites, the Analytics Edge Add-in allows you to build an efficient template for separating branded and non-branded search queries from the Google Search connector. More
article: Google Search: Branded Versus Non-Branded
The filtering capability in Google Search Console is very restrictive (single phrase match), making it useless for separating branded from non-branded search terms in all but the simplest cases. Enter the Analytics Edge Add-in — a quick regular expression filter and your work is done. More
article: Google Search: Get 16 Months Of Search Data
The Google Search API now supports a full 16 months of historical data, but the only date-related field is ‘date’, so this is how to get all that data out in a meaningful way — in weekly or monthly buckets. The Google Search Connector from Analytics Edge provides a MultiQuery tab that does just what you need, and your appears in Excel in seconds! More
article: Misunderstood Metrics: GA 4 Bounce Rate
What is the bounce rate in Google Analytics 4? Is it better to be higher or lower? What is typical? Does it affect my search engine rankings? Here is some insight into this commonly misunderstood metric. More
report: Google Search: CTR vs Position Analysis
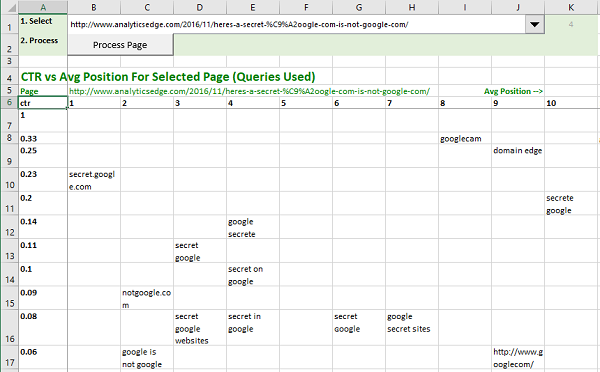 When embarking on an SEO review for a website, it helps to be able to see what queries are already ranking and how successful they are (click-through rate) at generating traffic. More
report: Google Search: Position Distribution – More Than Just An Average
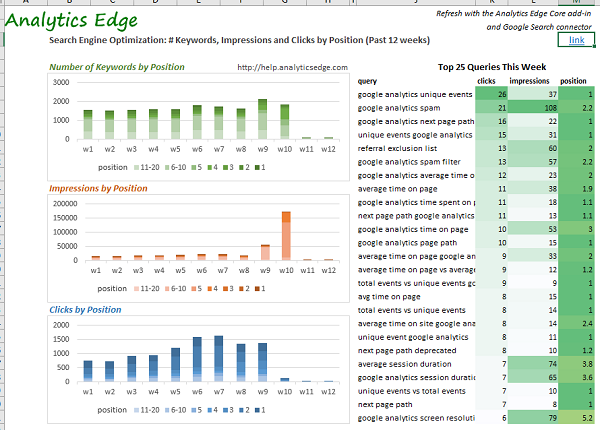
The Google Search Console metric for “position” is an average, and it doesn’t tell the whole story. This report looks at the individual queries used for each of your pages over the past 12 weeks, groups them by position, and shows you the distribution of impressions and clicks by position.

article: Google Search: Download All Your Page And Query Data
Downloading your Google Search Console data into Excel is easy with Analytics Edge. The Google Search Connector uses the API to pull down all of the query and page metrics — without the 1000 or 5000 row limit imposed by the web interface. More
article: Google Search: Trends Reporting
With the Analytics Edge Google Search connector, you can easily get week-to-week or month-to-month reporting in a single query. More
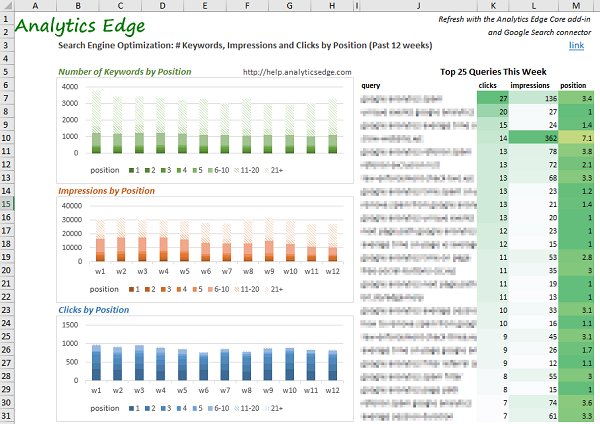
report: Google Search: SEO Summary Report
Search Engine Optimization is a changing market. It’s not about keywords, it’s about topics and long-tail in aggregate. This free report summarizes your website’s appearance in search, showing the distribution of the # of keywords, impressions and clicks by position.
report: Google Search: Top Queries Trend
 See 10 weeks worth of Google Search Console data in one report. Analytics Edge makes it easy with this workbook and the Connector for Google Search. More
report: Google Search: SEO Results Trends
See how your content marketing or search optimization efforts have affected traffic to your site with this free Microsoft Excel report. Enter the target phrase and your account and website information, then let the Analytics Edge Add-in and Google Search Connector take care of the rest.
![]()
report: Google Search: Top Pages And Queries This Week
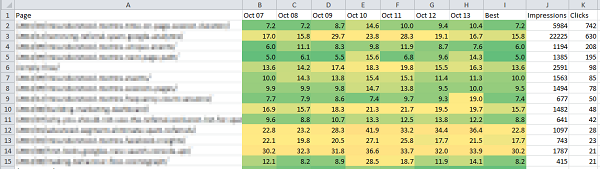 See a day-by-day position changes for the top queries and pages for your website over the past week, direct from Google Search Console. More
report: Google Search: Weekly Ranking Report
 See a week-by-week summary of the top queries and pages for your website, direct from Google Search Console. More
report: Google Search: Long Tail Keyword Analysis
 This free Analytics Edge report lets you see long-term trends in the individual words used in search queries that showed you site. More
report: Google Search: Web vs Image vs Video Search Clicks
 This free workbook uses the Analytics Edge connector for Google Search to download your website search query performance for the past month, and compares the clicks coming from web search to those from image search. More
report: Google Search: Keeping Search Analytics Data
![]() Google Search Console provides some excellent insight into your website’s performance in search but it is limited to 90 days of history. More
Google Search Console provides some excellent insight into your website’s performance in search but it is limited to 90 days of history. More
report: Google Search: Queries by Country
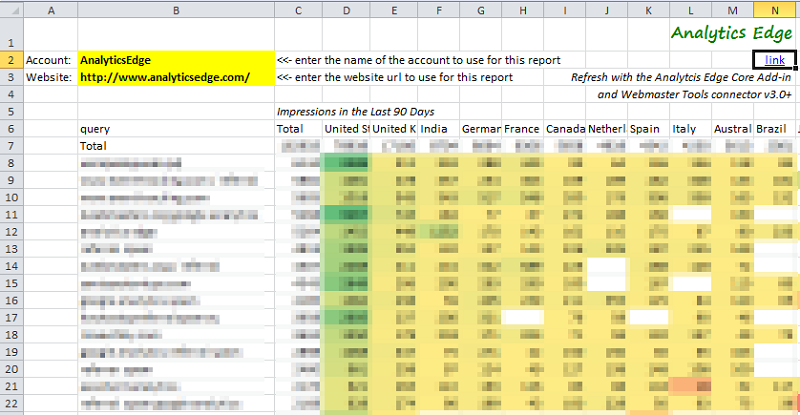 This free Analytics Edge report gets Google Search Analytics data for your website and displays your top queries distributed across the countries they came from. More
report: Google Search: Keywords for Top Landing Pages
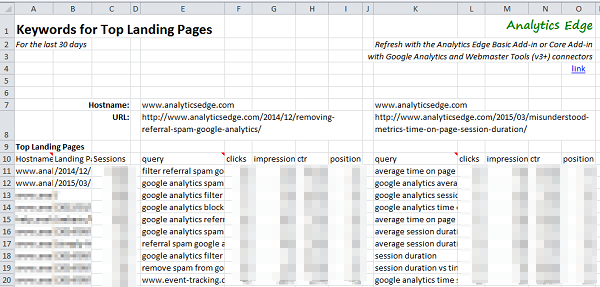 Yes, you can get the keywords for your top landing pages, but not from Google Analytics — they come from the Google Search Console. More
report: Google Search: Top Queries Report
 Get the top queries from Google Search Console for the past calendar month More
report: Google Ads: Campaign Report
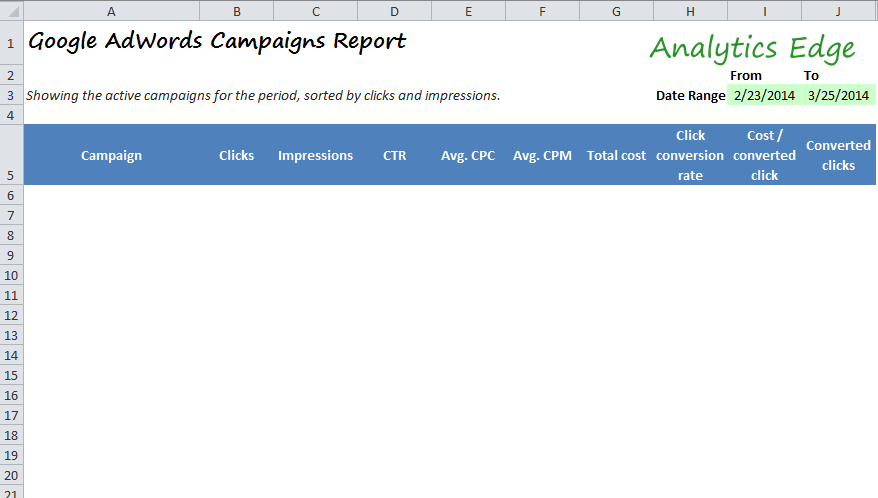 Download your Google Ads campaign activity for the past 30 days directly into Microsoft Excel. More
article: First Looks: Google’s New Search Console API
The long awaited Google Search Console (Webmaster Tools) API update is finally out, and here’s a quick review of some of the new capabilities and limitations. More
article: Google Analytics: Building a Multi-Site Report
With the Analytics Edge Add-in for Excel, you can easily build a multi-website report, quickly and without programming. This article and the attached sample workbook show how easy it can be. More
function: Search Analytics – Google Search
 The Search Analytics wizard of the Google Search connector allows you to get a report of the performance of your websites in Google Search.
More
function: Customers – Google Ads
The Customers wizard of the Google Ads connector is used to list customers for a selected login accounts. With regular Ads accounts, it will list your account, but for MCC accounts, it will list all customer accounts associated with the MCC account. More
function: Site Admin – Google Search
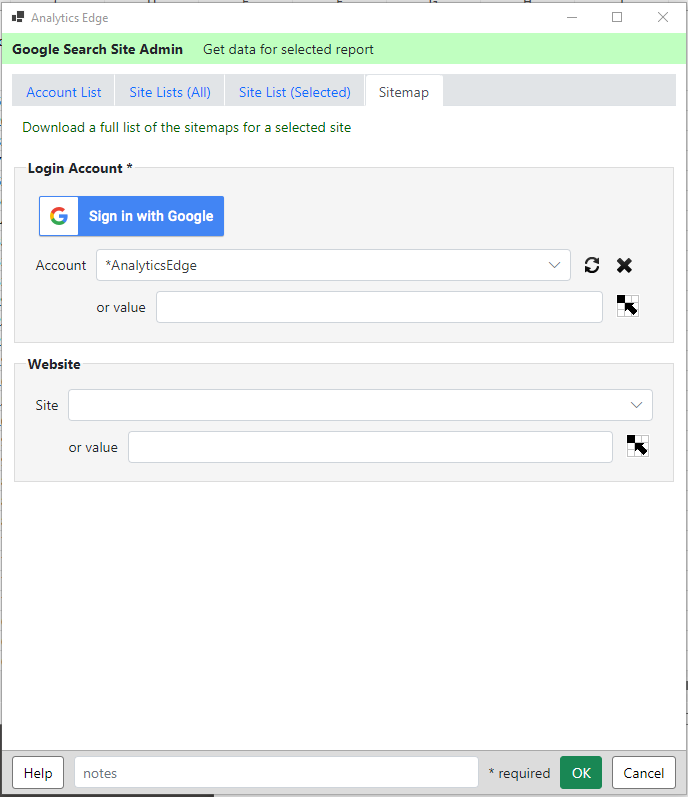 Download a list of the accounts, sites or sitemaps for the selected account and/or website. More
article: Tips for Google Analytics Reporting
Analytics Edge makes it easy to get data from Google Analytics into Excel, and here are a few tips to make it easier to build impressive reports. More
function: Accounts – Google Ads
 The Accounts wizard is used to manage saved Google Ads accounts for use by the connector. For security reasons, Analytics Edge stores your account information in an encrypted file on your computer, not in the workbook. Accounts are stored using Reference names, and the queries in your workbooks use a Reference name to identify which account to use.
More
function: Accounts – Google Search Console
 The Accounts wizard is used to manage saved Google Search Console accounts for use by the connector. For security reasons, Analytics Edge stores your account information in an encrypted file on your computer, not in the workbook. Accounts are stored using Reference names, and the queries in your workbooks use a Reference name to identify which account to use.
page: Analytics Edge Help Documentation
Support email: support@analyticsedge.com
More
article: Simplified Core Web Vitals Reporting
Google released new guidance on how to collect and report Core Web Vitals using Google Analytics 4, but the approach makes use of some pretty complicated concepts with BigQuery. In this article, I want to show you how to make similar reports in Excel using Analytics Edge with a lot less work and complexity. More
page: Misunderstood Metrics Series
Analytics reports are full of numbers with simple names like ‘sessions’ and ‘users’, but behind the scenes, things are not so simple. Many metrics are far more complex than the simple names suggest. The Misunderstood Metrics series digs into some of the common reporting combinations that are easily misinterpreted. More
page: Account not found
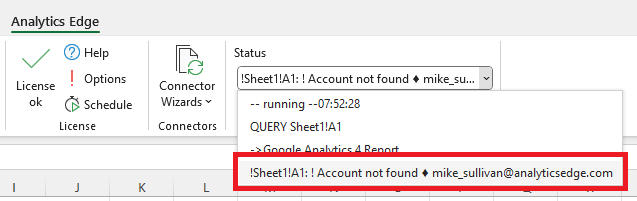
When you login with an Analytics Edge connector, the connector saves a security token, strongly encrypted, to your computer. The security token is saved using a ‘reference name’ as an identifier. Queries use the reference name and the connector gets the appropriate security token to use in the query. This allows you to share workbooks without giving away access to your accounts.
If the saved security token cannot be found during a query, you need to add it to your computer. This can happen if you update the software from an old version, or if you update or change the computer itself.
To do this, open the Connector Wizards > [connector] > Accounts wizard to see if your account is missing. Each connector manages its own saved accounts, so be sure to check the Accounts for the connector that triggered the error. Click the big Sign in with Google (or other) button to log into your account, check all the requested permission boxes, and save a new security token.
Account Reference Name
When the security tokens are saved, they are saved using a ‘reference name’. By default this is usually your email address, but it can be changed when you save the token. Make sure to enter the account ‘reference name’ exactly as shown in the error — it is case sensitive. The saved query uses the reference name to identify the account token to use, and the connector looks for that exact reference name in the saved accounts list.
function: Search Terms
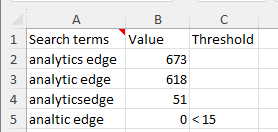 The Search Metrics wizard of the Google Business Profile connector allows you to get a report of the search terms that showed your Business Profile in the search results.
If the number of searches is below a threshold level, the threshold will be reported.
function: Performance Report
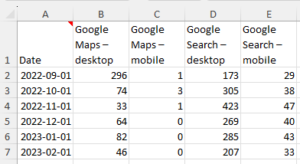 The Performance Report wizard of the Google Business Profile connector allows you to get a trend report for a several metrics. More
page: !Change Log – Desktop App
The latest release is always available from the Download page.
Version 1.32.0.0 (2024-10-28)
- Bing Webmaster: fixed several reports; added date range capability; added preset date ranges
- Google Search: removed unsupported connection type from Chrome UX report
- Arrange function: fixed insert column by name selection
- File-Google Sheets panel redesigned
Version 1.31.0.0 (2024-10-12)
- Handles large data significantly faster, especially Pivot
- Pivot: added option to limit data processed to reduce likelihood of out-of-memory errors
- Updated algorithms for Combine, Compare, Lookup, Pivot to improve speed and use less memory
- LinkedIn Ads: updated to 202409 API (no functional change)
- License: activate buttons for license keys now appear as ‘activate’ text to avoid confusion
- Cancel button moved above status dropdown on ribbon
- All data processing pushed to background thread to keep product responsive
- Cleaned up some threading problems to make the product more stable
- Implemented security updates in underlying technology
- Ensured that all functions are cancellable
- Updated code to use optimizations available in .NET 8
Version 1.30.0.0 (2024-09-15)
- Combine function: fixed problems with ‘First’ aggregation
- Google Search: properly indicate account problems in wizards
- LinkedIn Ads: update to API 202408
- Bing Ads: updated fields list
- License wizard: added checks for entered but unactivated license keys; About tab improvements
- fixed item deleteion problems in reorderable lists in several wizards
- column name match is now case insensitive
- improvements to connector error reporting
- improvements to debug and exception logging
- privacy improvements: exceptions now logged only to local files when in debug mode
Version 1.29.0 (2024-08-14)
- fixed changes to lists reverting to previous state
- added shadow to dropdown lists
Version 1.28.0 (2024-07-31)
- Google Search: Chrome UX Report fixed cell references for Url/Origin; fixed checkbox for Url selection
- Google Search: Url Inspection fixed cell references for Url
- Google Search: PageSpeed Insights fixed cell references for Url
- Fixed occasional problems with cell display and editing
Version 1.27.0 (2024-07-30)
- Facebook Ads: updated Reports wizard and fixed several bugs with By Action breakdown reports; properly report errors
- fixed problems when deleting entries in several wizards and connectors
- improved error handling
Version 1.26.1 (2024-07-23)
- debug mode enhancements
Version 1.26.0 (2024-07-20)
- fixed a problem with Step Results sheet not displaying properly
- auto-activates connector trials on first use
- debug mode (per Options) now dumps full debug info for API calls
- exception logging (when in debug mode) now keeps timestamped exceptions
- Microsoft Ads: fixed login problems when using multiple accounts
- Microsoft Ads: added error in Reports wizard when selected account requires refresh
- Bing Webmaster: fixed problem when Reports wizard opened without a saved account
- Facebook Ads: properly reports bad account errors
- deletes old temp files monthly
Version 1.25.0.0 (2024-07-15)
- Google Analytics: added the ability to create your own dynamic calculated metrics that do not affect your account limits
- Google Analytics: fixed a problem were comparison date ranges are reversed in reports
- Google Analytics: now properly reports errors when there are account permission problems
- debug mode now captures a stack trace to a local file
- Pivot: now properly handles a datetime column with different time components as a key column
- Google Search: PageSpeed Insights, Chrome UX Report and URL Inspection now accept range names with multiple values for bulk queries
Version 11.24.0.0 (2024-06-30)
- Removed Universal Analytics functions from the Google Analytics connector (goodbye UA!)
- Fixed a problem with GA4 reports involving multiple properties
- ‘Accounts’ on main panel renamed to ‘Options’; added debug mode option
- Added YouTube Analytics connector (early release, only in debug mode, contact support for access)
- Fixed some bugs when working with multiple workbooks
- Added option to turn off usage tracking in License wizard
Version 11.23.0.0 (2024-06-16)
- Read Google Sheet: updated wizard layout; bug fixes
- Write to Google Sheet: updated wizard layout; bug fixes
- improved validation checks in several wizards
Version 1.22.0.0 (2024-06-09)
- Google Ads: updated to v17 API (adds campaign aggregate asset view and channel aggregate asset view)
- fixed note functionality in several wizards (adds comment to macro entry in task pane)
Version 1.21.0.0 (2024-06-07)
- Constant Contact: NEW added connector with V3 API support and new functions (Accounts, Account Information, Campaign Reports, Campaigns, Contacts)
- Fixed some misbehaving cell reference buttons in several connectors (Facebook Insights, Facebook Ads, Google Analytics) and function wizards (Read Google Sheets, Write Google Sheets
Version 1.20.0.0 (2025-05-31)
- Facebook Ads: updated to API v20; fixed a problem when deleting accounts; fixed a problem when using ad account id cell references
- Google Ads: updated to API v16; added autoretry when API return null response;
- Google Analytics: changed filter indenting to make filter priority more obvious; made filter list boxes bigger in wizards; fixed a problem with duplicate filter expressions
- LinkedIn Ads: updated to API v202405; added impression device and placement name dimensions, qualified lead metrics
- Filter, RunMacro, QuickFunctions: changed filter expression indenting to clarify priority
Version 1.19.1.0 (2024-05-13)
- fixed a build problem causing a Syncfusion license warning
Version 1.19.0 (2024-05-10)
- Facebook Ads: fixed Ads Listing when referencing cell for account and ad account
- Facebook Ads: added ability to query per campaign, or query per ad set, to avoid 500 internal error caused by asking for too much in a single query
- Google Analytics: now automatically updates to new fields when editing queries (e.g. conversion -> keyEvents)
- Google Analytics: fixed multi-property queries when referencing a worksheet [range]
Version 1.18.6 (2024-04-27)
- fixed start and end date editing problems with several connector wizards
- Google Business Profile: fixed Last 6 Months selection; fixed search terms editing problems
Version 1.18.5 (2024-04-22)
- Facebook Ads: fixed filtering on campaign/ad set/ad names
- Google Ads: filtering on text filed now auto-wraps expression in single quotes as required
- Google Ads: fixed some error handling problems
- LinkedIn Ads: updated to latest API
- improved Facebook login stability; enabled retry of Code login
- added SMTP back into Save to Workbook/PDF functions
- Convert: fixed date->text with ISO Year and ISO Week conversions
- Filter/Run…If…: fixed And/Or missing on second filter added
Version 1.18.0 (2024-03-28)
- cleaned up help references
- Bing Webmaster: reports wizard updated for consistency with other connectors
- Google Search: fixed date comparison options for difference and % changed
Version 1.17.0 (2024-03-24)
- Google Search: fixed country filtering
- Fixed a variety of user interface quirks in selected fields, filter rules and sort rules list boxes
- Fixed several account wizards not properly closing
- License wizard: fixed licensing problems with Microsoft Ads connector
- Google Analytics – GA4 Report: added Minimize Sampling option
- Google Analytics – Realtime Report: fixed filter and sort options, field names
- fixed a problem where caching prevented downloading of the latest release
- Replace function: fixed a problem for [range name] usage in find or replace text field
- fixed a problem where some text in wizards was obfuscated (made meaningless)
Version 1.15.0 (2024-03-07)
- Microsoft Ads: fixed problem refreshing security tokens
- fixed a problem where wizard Cancel buttons don’t work
- added ability to type-to-filter in many dropdown controls
- fixed a problem where dropdowns may not close when selection clicked
- Google Ads: fixed a problem where opening the wizard crashed
- faster wizard opening
- Google Business Profile: consolidated single/multiple metric functions into single Performance Report function
- fixed a problem selecting macros in the Task Pane
Version 1.14.0 (2024-03-05)
- Added Google Business Profile connector (early release – contact support for access)
- cleaned up login functionality in many connector wizards
- cleaned up multithreading problems in several wizard Fields panels
- Google Ads: fixed a pagination problem; fixed sort panel problems
- Google Analytics: now reports sampling metrics in Status log after each query
- SaveToPdf/Workbook: proeprly offer Microsoft Email and Gmail account options
- Read/Write To Google Sheets: properly offer Google account options
- License/About: migrated to popup window identical to the Add-in
- Accounts: migrated to popup window identical to the Add-in
- License: added Update section to simplify updates
- Fixed stability problem affecting several wizard and connectors
- Microsoft Ads: improved login experience for multi-account users
- Fixed problems with several connectors when modifying selected fields
Version 1.12.1 (2024-02-22)
- fixed problem with Append to Worksheet function
- fixed a problem where debug sheet did not show last row of data
Known Issues:
- On MacOS: pressing Enter in popup dialogs (new macro name, file name, etc) ignores the text entered; WORKAROUND: click the OK button instead
Previously in v1.12.0 and earlier
- updated Microsoft Ads and Microsoft Email logins to permit specifying an alternative email address to log into (other that the default that the browser remembers)
- improved error handling in Read/Write Google Sheets wizard
- added Date Comparison capability to the GA4 Reports query
- fixed problems with Read/Write Google Sheets wizards
- fixed a problem where wizards sometimes open empty
- fixed problems licensing and logging in with the Microsoft Ads connector
- Fixed a problem with scheduling a workbook refresh
- Fixed a problem with updates not picking up new metadata files
- added Facebook Ads connector
- fixed a problem with updates not picking up new metadata files
- Microsoft Ads: fixed Budget report
- Google Ads: fixed cache file location
- LInkedIn Ads: updated to 202402 API; limited to 1000 rows due to bug in API
- removed Google BigQuery connector early access warnings
- Google Ads connector now automatically handles multiple assets in reports (as multiple rows)
- added new Google Big Query connector (early release)
- added filter expression copy button to GA4 Report wizard
- fixed a problem for grandfathered Basic add-in licenses
- fixed the expiry date display for the Add-in in the Licnese wizard
- fixed a problem with the Step Results sheet not properly displaying during Quick Query
- properly handle large Google Analytics account listings
- new function Google Analytics > GA4 Realtime query
- fixed the refresh selected queries dialog
- fixed Google Search > Search Analytics query with cell reference for date end
- fixed problems with multiple connectors when adding new accounts
- fixed multiple connectors not handling cell reference values properly when editing query
- Google Ads connector now rebuilds account in-memory cache if Excel is restarted
- fixed problem editing Google Ads queries
- updated Google Ads to v15 API with latest fields; may affect how assets are reported
- added to Quick Filter > Arrange function the ability to convert MultiColumn (-1,-2) to MultiRow similar to full Arrange function in macros
- 1.6.1 fixes a problem affecting startup for new installations
- cleaned up Google Sheets folder navigation in Read Google Sheets and Write Google Sheets functions
- fixed configuration folder handling for non-typical installations
- added split by semicolon option to Web Request function
- added functions Read Google Sheet and Write Google Sheet
- fixed startup crash
- fixed blank Step Results sheet problem
page: !Change Log – Add-in
The latest release is always available from the Download page.
Version 11.32.0 (2024-10-28)
- Bing Webmaster: fixed several reports; added date range capability; added preset date ranges
- Google Search: removed unsupported connection type from Chrome UX report
- Arrange function: fixed insert column by name selection
Version 11.31.0 (2024-10-12)
- Handles large data significantly faster, especially Pivot and writing to Excel
- Pivot: added option to limit data processed to reduce likelihood of out-of-memory errors
- Updated algorithms for Combine, Compare, Lookup, Pivot to improve speed and use less memory
- Improved speed of writing very large blocks of data to Excel with status updates
- Writing to Google Sheets now properly reports any errors
- LinkedIn Ads: updated to 202409 API (no functional change)
- License: activate buttons for license keys now appear as ‘activate’ text to avoid confusion
- Cancel button moved above status dropdown on ribbon
- All data processing pushed to background thread to keep product responsive
- Cleaned up some threading problems to make the product more stable
- Implemented security updates in underlying technology
- Ensured that all functions are cancellable
- Updated code to use optimizations available in .NET 8
Version 11.30.0 (2024-09-15)
- Combine function: fixed problems with ‘First’ aggregation
- Google Search: properly indicate account problems in wizards
- LinkedIn Ads: update to API 202408
- Bing Ads: updated fields list
- License wizard: added checks for entered but unactivated license keys; About tab improvements
- fixed item deleteion problems in reorderable lists in several wizards
- column name match is now case insensitive
- improvements to connector error reporting
- improvements to debug and exception logging
- privacy improvements: exceptions now logged only to local files when in debug mode
Version 11.29.2 (2024-08-26)
- should stop 0x800AC472 errors when interacting with Excel during a refresh
Version 11.29.0 (2024-08-14)
- Facebook Insights: removed deprecated metrics
- fixed changes to lists reverting to previous state
- added shadow to dropdown lists
Version 11.28.0 (2024-07-31)
- Google Search: Chrome UX Report fixed cell references for Url/Origin; fixed checkbox for Url selection
- Google Search: Url Inspection fixed cell references for Url
- Google Search: PageSpeed Insights fixed cell references for Url
Version 11.27.0 (2024-07-30)
- Facebook Ads: updated Reports wizard and fixed several bugs with By Action breakdown reports; properly report errors
- fixed problems when deleting entries in several wizards and connectors
- improved error handling
- updated installer to check for latest .Net Desktop Runtime version (8.0.7)
Version 11.26.1 (2024-07-22)
- debug mode enhancements
Version 11.26.0 (2024-07-20)
- auto-activates connector trials on first use
- debug mode (per Options) now dumps full debug info for API calls
- exception logging (when in debug mode) now keeps timestamped exceptions
- Microsoft Ads: fixed login problems when using multiple accounts
- Microsoft Ads: added error in Reports wizard when selected account requires refresh
- Bing Webmaster: fixed problem when Reports wizard opened without a saved account
- Facebook Ads: properly reports bad account errors
- deletes old temp files monthly
Version 11.25.0 (2024-07-15)
- Google Analytics: added the ability to create your own dynamic calculated metrics that do not affect your account limits
- Google Analytics: fixed a problem were comparison date ranges are reversed in reports
- Google Analytics: now properly reports errors when there are account permission problems
- debug mode now captures a stack trace to a local file
- Pivot: now properly handles a datetime column with different time components as a key column
- Google Search: PageSpeed Insights, Chrome UX Report and URL Inspection now accept range names with multiple values for bulk queries
Version 11.14.0 (2024-06-29)
- Removed Universal Analytics functions from the Google Analytics connector (goodbye UA!)
- Fixed a problem with GA4 reports involving multiple properties
- ‘Accounts’ button on ribbon renamed to ‘Options’; added debug mode option
- Added YouTube Analytics connector (early release, only in debug mode, contact support for access)
- Fixed a problem with running multiple Analytics Edge queries or macros from VBA
- Added option for VBA RunMacro commands to run without popup messages
- Fixed some bugs when working with multiple workbooks
- Removed old MailChimp connector
- Added option to turn off usage tracking in License wizard
Version 11.23.0 (2024-06-16)
- Read Google Sheet: updated wizard layout; bug fixes
- Write to Google Sheet: updated wizard layout; bug fixes
- improved validation checks in several wizards
Version 11.22.1 (2024-06-11)
- Google Ads: fixed a problem with some combinations of fields in the new views in v17 API
- Google Search: fixed the Search Analytcis wizard to clarify that date comparison cannot be used with multi-query options
- Write to Text File: fixed a problem when writing an empty table where the add-in did not create any file; now it creates an empty file
Version 11.22.0 (2024-06-09)
- Google Ads: updated to v17 API (adds campaign aggregate asset view and channel aggregate asset view)
- fixed a problem when working with multiple workbooks open
- fixed note functionality in several wizards (adds comment to macro entry in task pane)
Version 11.21.0 (2024-06-07)
- Constant Contact: added V3 API support with new functions (Accounts, Account Information, Campaign Reports, Campaigns, Contacts); fixed cell references for dates
- Fixed some misbehaving cell reference buttons in several connectors (Facebook Insights, Facebook Ads, Google Analytics) and function wizards (Read Google Sheets, Write Google Sheets
Version 11.20.0 (2024-05-31)
- Constant Contact: implemented workaround to retry intermittent API problems
- Facebook Insights: updated to API v20; removed permission request causing error during login
- Facebook Ads: updated to API v20; fixed a problem when deleting accounts; fixed a problem when using ad account id cell references
- Google Ads: updated to API v16; added autoretry when API return null response;
- Google Analytics: changed filter indenting to make filter priority more obvious; made filter list boxes bigger in wizards; fixed a problem with duplicate filter expressions
- LinkedIn Ads: updated to API v202405; added impression device and placement name dimensions, qualified lead metrics
- Filter, RunMacro, QuickFunctions: changed filter expression indenting to clarify priority
- Updated ExcelDna to v1.8 (technology enabling Excel add-in)
Version 11.19.0 (2024-05-10)
- Facebook Ads: fixed Ads Listing when referencing cell for account and ad account
- Facebook Ads: added ability to query per campaign, or query per ad set, to avoid 500 internal error caused by asking for too much in a single query
- Google Analytics: now automatically updates to new fields when editing queries (e.g. conversion -> keyEvents)
- Google Analytics: fixed multi-property queries when referencing a worksheet [range]
Version 11.18.7 (2024-04-29)
- fixed a problem with scheduled refreshes that may have caused double refreshes or errors
Version 11.18.6 (2024-04-27)
- fixed start and end date editing problems with several connector wizards
- Google Business Profile: fixed Last 6 Months selection; fixed search terms editing problems
Version 11.18.5 (2024-04-22)
- Facebook Ads: fixed filtering on campaign/ad set/ad names
- Google Ads: filtering on text filed now auto-wraps expression in single quotes as required
- Google Ads: fixed some error handling problems
- LinkedIn Ads: updated to latest API
Version 11.18.4 (2024-04-08)
- fixed scheduled refresh functionality
Version 11.18.3 (2024-04-04)
- improved startup stability
- improved Facebook login stability; enabled retry of Code login
Version 11.18.2 (2024-04-02)
- added SMTP back into Save to Workbook/PDF functions
- Accounts (Add-in): fixed SMTP settings not being saved
Version 11.18.1 (2024-03-31)
- Convert: fixed date->text with ISO Year and ISO Week conversions
- Filter/Run…If…: fixed And/Or missing on second filter added
Version 11.18.0 (2024-03-27)
- cleaned up help references
- Bing Webmaster: reports wizard updated for consistency with other connectors
- Google Search: fixed date comparison options for difference and % changed
Version 11.17.0 (2024-03-24)
- Google Search: fixed country filtering
- Fixed a variety of user interface quirks in selected fields, filter rules and sort rules list boxes
- Fixed several account wizards not properly closing
Version 11.16.1 (2024-03-20)
- License wizard: fixed licensing problems with Microsoft Ads connector
Version 11.16.0 (2024-03-14)
- Google Analytics – GA4 Report: added Minimize Sampling option
- Google Analytics – Realtime Report: fixed filter and sort options, field names
- fixed a problem where caching prevented downloading of the latest release
- Replace function: fixed a problem for [range name] usage in find or replace text field
- fixed a problem where some text in wizards was obfuscated (made meaningless)
Version 11.15.1/11.15.2/11.15.3 (2024-03-11)
- fixed Google Analytics UA Report filters
Version 11.15.0 (2024-03-07)
- Microsoft Ads: fixed problem refreshing security tokens
- fixed a problem where wizard Cancel buttons don’t work
- added ability to type-to-filter in many dropdown controls
- fixed a problem where dropdowns may not close when selection clicked
- Google Ads: fixed a problem where opening the wizard crashed
- faster wizard opening
- Google Business Profile: consolidated single/multiple metric functions into single Performance Report function
Version 11.14.0 (2024-03-05)
- Added Google Business Profile connector (early release – contact support for access)
- cleaned up login functionality in many connector wizards
- cleaned up multithreading problems in several wizard Fields panels
- Google Ads: fixed a pagination problem; fixed sort panel problems
- Google Analytics: now reports sampling metrics in Status log after each query
- SaveToPdf/Workbook: proeprly offer Microsoft Email and Gmail account options
- Read/Write To Google Sheets: properly offer Google account options
- License: fixed browse button for user configuration folder
Version 11.13.0 (2024-02-29)
- Ribbon now shows version of update available
- License: added Update section to simplify updates
- Fixed stability problem affecting several wizard and connectors
- Add-in should properly resume from Sleep mode
- Microsoft Ads: improved login experience for multi-account users
- Fixed problems with several connectors when modifying selected fields
Version 11.12.1 (2024-02-22)
- updated Microsoft Ads and Microsoft Email logins to permit specifying an alternative email address to log into (other that the default that the browser remembers)
- updated Add-in Accounts login wizard to properly report status in the wizard title
- Add-in should properly resume after computer resuming from sleep/suspend
- improved error handling in Read/Write Google Sheets wizard
Previously in version 11.12.0 and earlier
- added Date Comparison capability to the GA4 Reports query
- fixed problems with Read/Write Google Sheets wizards
- fixed a problem where wizards sometimes open empty
- fixed problems licensing and logging in with the Microsoft Ads connector
- Fixed a problem with scheduling a workbook refresh
- Fixed a problem with updates not picking up new metadata files
- Microsoft Ads: fixed Budget report
- Facebook Ads: updated wizard UI; breaking changes: metrics always follow dimensions, dropped filter by Placement
- Google Ads: fixed cache file location
- LInkedIn Ads: updated to 202402 API; limited to 1000 rows due to bug in API
- reintroduce Task PAne button on ribbon
- fix Facebook Ads 250 row limit; update Ads Listing wizard
- fixed loss of Microsoft Ads connector from License wizard; removed Google BigQuery connector early access warnings
- Google Ads connector now automatically handles multiple assets in reports (as multiple rows)
- fixed Facebook login in Facebook Insights and Facebook Ads connectors
- Facebook Ads connector now displays campaigns properly
- added new Google Big Query connector (early release)
- added filter expression copy button to GA4 Report wizard
- fixed a problem for grandfathered Basic add-in licenses
- fixed the expiry date display for the Add-in in the Licnese wizard
- fixed a problem with the Step Results sheet not properly displaying during Quick Query
- properly handle large Google Analytics account listings
- new function Google Analytics > GA4 Realtime query
- fixed the refresh selected queries dialog
- fixed Google Search > Search Analytics query with cell reference for date end
- fixed problems with multiple connectors when adding new accounts
- fixed Facebook Ads connector changing previous selections when editing query
- fixed multiple connectors not handling cell reference values properly when editing query
- Google Ads connector now rebuilds account in-memory cache if Excel is restarted
- updated Facebook Insights connector to latest API release
- updated Facebook Ads connector to latest API release
- 1.7.1 – fixed Facebook account problems with Facebook Insights and Facebook Ads connectors; may require account refresh
- fixed problem editing Google Ads queries
- updated Google Ads to v15 API with latest fields; may affect how assets are reported
- added to Quick Filter > Arrange function the ability to convert MultiColumn (-1,-2) to MultiRow similar to full Arrange function in macros
- cleaned up Google Sheets folder navigation in Read Google Sheets and Write Google Sheets functions
- fixed configuration folder handling for non-typical installations
- added split by semicolon option to Web Request function
- skipped version numbers to synchronize with the Desktop App (Addin v11.5.0 shares code with Desktop App v1.5.0)
- production release of the Add-in, stability and bug fixes to the Desktop App
- dropped SMTP email, added Microsoft email to the Save to PDF/Save to Workbook wizards
function: Save/Email PDF
 This wizard lets you save an Adobe PDF copy of the Excel workbook, and optionally email it to someone. Email options include SMTP email or Google Gmail. More
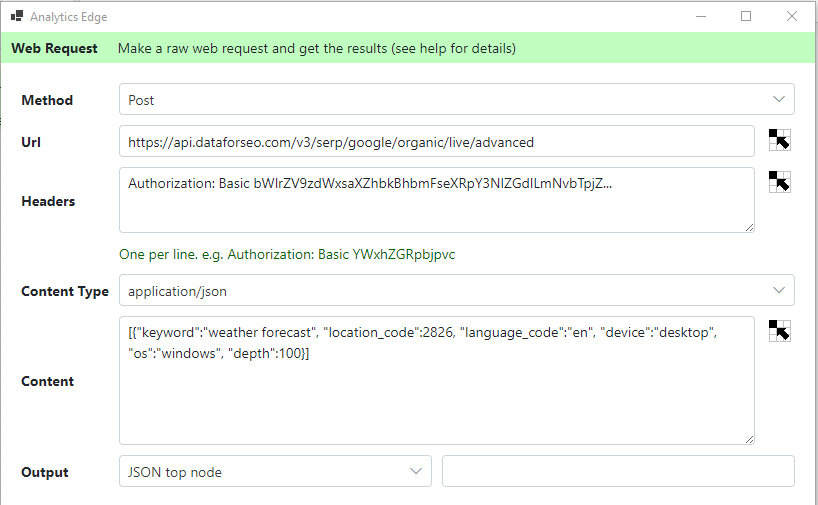
article: Use Web Request Function To Query DataForSEO API
This article shows how to use the Analytics Edge ‘Web Request’ function to make an API query, using the DataForSEO API as an example (a free trial of the API is avaialble). The same approach can be used for other API’s that use simple authentication schemes.
function: Save/Email Excel Workbook
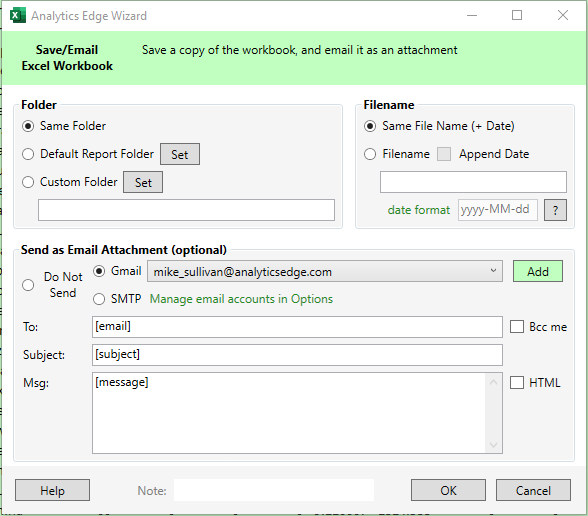 This wizard lets you save an Excel workbook copy or your report, and optionally email it to someone. Email options include SMTP email or Google Gmail. More
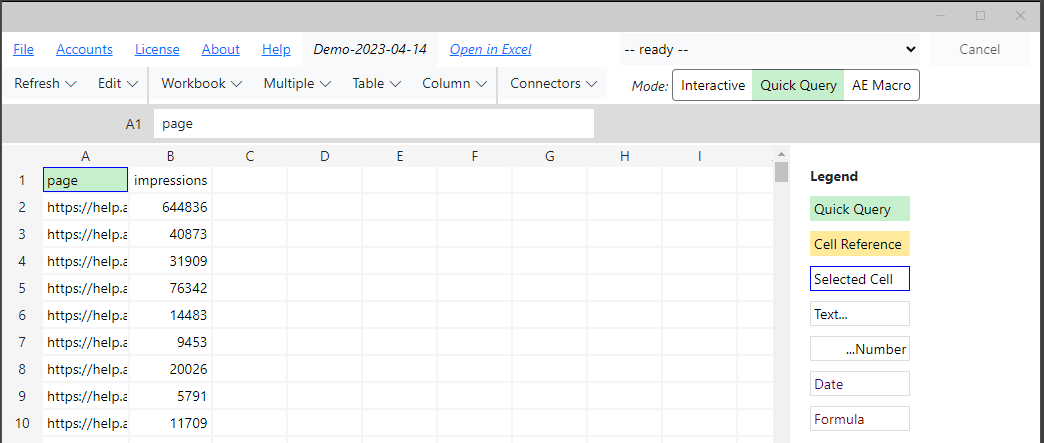
function: * Desktop App Orientation
When you open a file, the App interface mimics a typical spreadsheet application, with a menu bar, a strip to display or edit cell contents, a worksheet display area, and a task pane area.
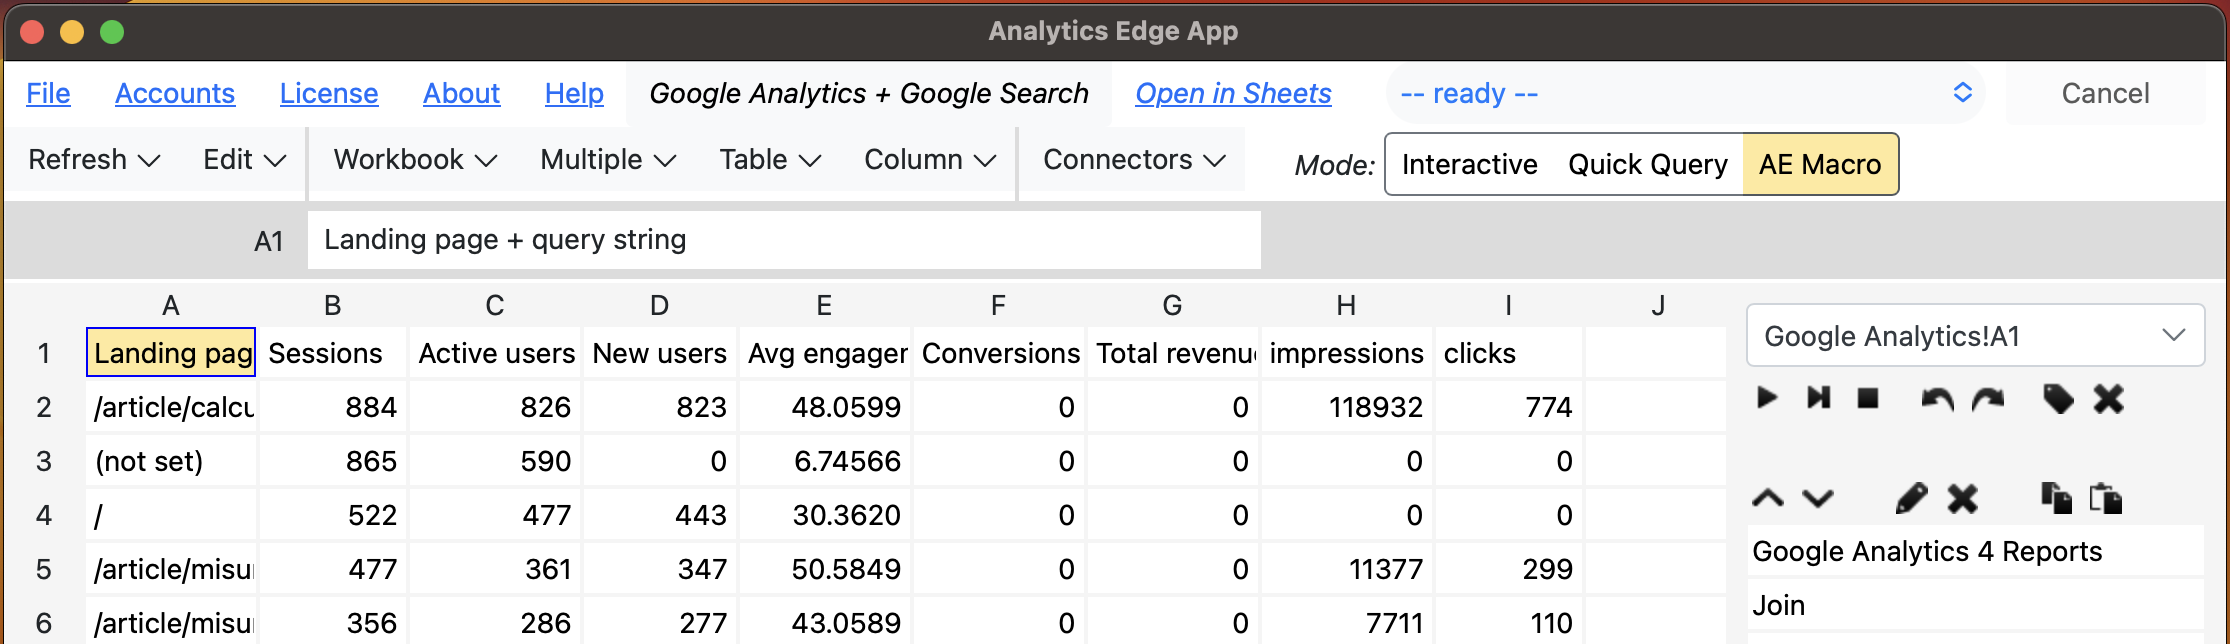
function: * Desktop App
How can I help? Email: support@analyticsedge.com
The Analytics Edge Desktop App is a standalone application that provides spreadsheet report automation to both Google Sheets and Excel files on Windows or MacOS computers.
article: Using Interactive Range Names
 When you use Analytics Edge in the Interactive mode, the data from the selected workbook is available for the wizard you open. For some wizards, like the new Google Search connector’s URL Inspection query, this allows you to process multiple URLs at once. More
article: Incremental Report Updates
I f your monthly report is regularly pulling down a full year’s worth of data, it is probably downloading 11 months of data that hasn’t changed. You can speed things up by doing an incremental update — just download the data you need. More
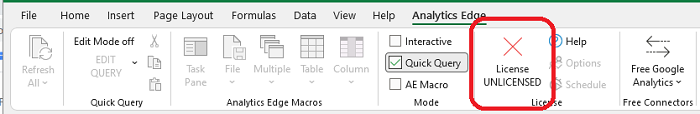
page: 2.0 Activate License
The first time you start Excel after installing the Analytics Edge Core Add-in, you should see a new ribbon bar entry. To start using Analytics Edge, click the License button.
article: Reading Sitemaps to Get a Full Listing of Pages
When analyzing website traffic, there are times you might want a full listing of the website’s pages…even those that never get any traffic or impressions. Google Analytics and Google Search Console will only report on pages were there is data, so these unrecognized pages continue to be overlooked. This article shows how the Analytics Edge Add-in can read the website’s sitemap files to extract a full listing of pages. More
page: When Your Employee Quits
People join and leave organizations all the time, so if the person running Analytics Edge reports for you leaves, this article outlines some of the things you need to deal with. More
article: Calculating a Weighted Average (Average of Averages)
A common reporting challenge in Excel is merging sets of data, such as combining monthly numbers for a quarterly or annual total. Adding up simple metrics is obvious, but what do you do with things like the average position or conversion rate? [Hint: you should not average or total anything that is already an average or ratio] More
article: Misunderstood Metrics: GSC Average Position
Google Search Console makes it easy to track the position of your website pages in Google’s search results, but the numbers are averages, and averages don’t tell the whole story. When it comes to search engine ranking, they can be really misleading. More
article: *Building a Marketing Dashboard in Excel
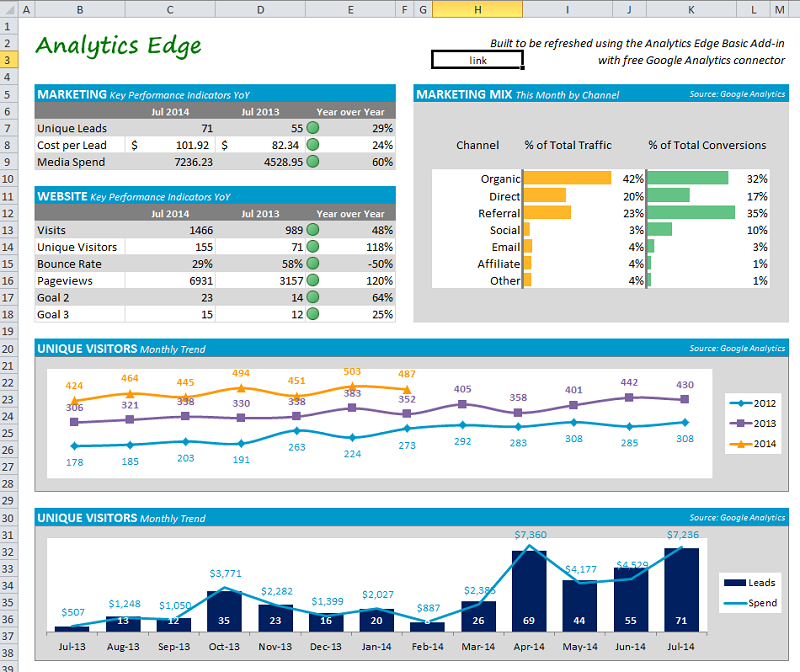 This article describes the steps I went through to build a working prototype; it is light on process and documentation because this is an educational article, not a technical how-to article. More
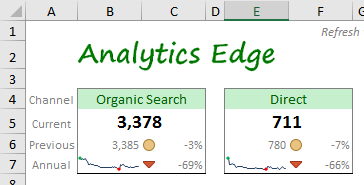
article: Creating an Excel Dashboard Widget
Creating a dashboard in Excel can be quite simple –it’s really just a matter of downloading the right data and some easy formatting techniques. Layout is your challenge, but even that can be overcome.
article: Making a CTR versus Position Chart By Device
The Analytics Edge Add-in is perfect for doing a quick analysis of search engine ranking data. In this article, I show how to get a CTR versus Position chart by Devices — showing the difference for click-thorough-rate of desktop versus mobile. More
function: * Add-in for Excel
How can I help? Email: support@analyticsedge.com
BETA: AnalyticsEdgeTroubleshooter-64bit.exe for 64-bit Excel installations
BETA: AnalyticsEdgeTroubleshooter-32bit.exe for 32-bit Excel installations
The Analytics Edge Add-in for Excel is an add-in for the Windows version of Microsoft Excel that provides spreadsheet report automation tightly intergrated with Excel.

article: Year-Over-Year Reporting
If you are trying to build a Google Analytics report comparing one year to the previous one, you can use the Pivot operation to make charting easier. The trick is to choose your dimensions wisely. More
article: Manually Scheduling a Refresh
If you want to refresh a workbook more than once a day, or if you simply want to control the refreshes yourself, this article shows how the Analytics Edge Add-in interacts with the Windows Task Scheduler app. More
article: Amazing SEO Reporting In Excel
With version 4.0 of the Analytics Edge Google Search connector, you can quickly create SEO analysis reports with tremendous insight potential; way beyond what you can do in Google Search Console itself! More
article: Optimize Search Engine Rankings
How do we monitor and optimize our website presence and increase our search click-through rates? More
page: Free Reports
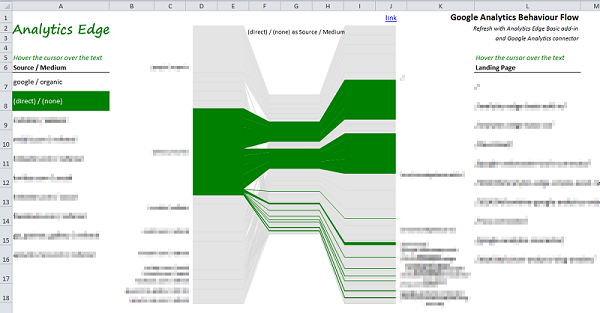
With Analytics Edge, there are plenty of free reports available to get you started fast. Whether you are using the free license or the more advanced Premium license, there are Analytics Edge samples leading you the way. If you don’t find what you are looking for, just ask: chances are that there is a quick solution. See the full listing at the right.
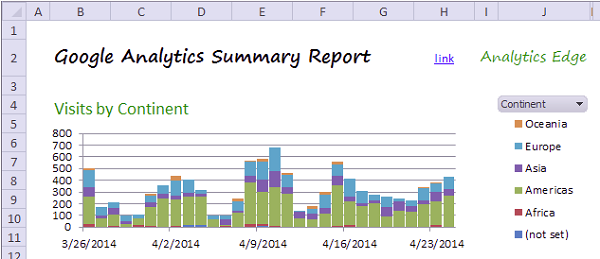
You will notice that there are simple reports, like the Google Analytics Summary Report, shown above, as well as some advanced Excel visualization techniques like the Interactive Behaviour Flow that come with links to how-to articles. Explore the free reports and articles for ideas that you can use in your reporting challenges. If you have questions, the support forum is your source for expert answers [paid products are entitled to confidential email support].
There are even workflow automation reports available, whether it is for agency reporting or just automating tedious multi-query analysis. Analytics Edge can do it all!
function: Accounts – Facebook Ads
 The Accounts wizard is used to manage saved Google Business Profile accounts for use by the connector. For security reasons, Analytics Edge stores your account information in an encrypted file on your computer, not in the workbook. Accounts are stored using Reference names, and the queries in your workbooks use a Reference name to identify which account to use.
More
article: Year-Over-Year Comparison in One Query
Here’s a neat little technique you can use to get year-over-year comparisons in one query with the Google Analytics Pro connector from Analytics Edge. More
article: Using Worksheet Values to Determine Reporting Period
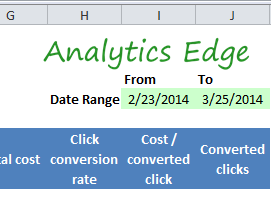 This article explores how to use date values in your Excel workbook to drive Analytics Edge connector queries, opening the door to a more interactive reporting experience within Excel. More
article: Long-Tail Keyword Analysis (Advanced Example)
Long-tail keyword phrases are often made up of many different combinations of similar words, making it difficult to tell when there is a common topic of interest. This article walks through the creation of a keyword analysis report, based on weekly snippets of data from Google Search Console. More
article: Multi-Source Waterfall Report
The wizard-based automation provided by the Analytics Edge Add-in for Excel makes it easy to combine data from multiple sources. This article explores how you can build a Waterfall Report that includes data from Google Webmaster Tools (now Google Search), Bing Webmaster Tools, Google Analytics and an external database. More
article: Data Sampling Problems In Annual Reports
Google Analytics uses statistical sampling to improve responsiveness for large queries. There is nothing wrong with statistical sampling — it will usually produce numbers close to the actual, but not always. More
article: New sign-in from Internet Explorer on Windows
If you just logged into Google Analytics from the Analytics Edge connector, you may get a warning email from Google, confirming the action you just took. More
article: Using the Repeat Macro Function
The Repeat Macro function in Analytics Edge lets you cycle through a list of items, repeating the rest of the Analytics Edge macro for each line in the source list. This article shows you how to use it. More
page: !Error Messages FAQ
When Analytics Edge encounters an error that it can’t handle automatically, the macro or query refresh stops running and the error message appears in the Task Pane or a popup dialog box. If the message is too long for the width of the task pane, you can click the message, and the full text will appear in a popup.
See Errors for a full listing of errors and actions.