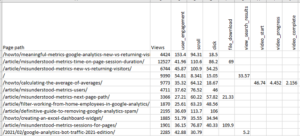
 This free Excel report works with the Analytics Core Add-in premium license and Google Analytics Pro connector to summarize the user engagement of your top website pages.
Leveraging Google Analytics 4’s user engagement metrics, this report summarizes the engagement time for different event types for your most engaging pages. It downloads your Google Analytics 4 data using the capability in the Google Analytics Pro connector (v4.25 or higher). The data is then transformed automatically by an Analytics Edge macro to filter out low engaging pages and display the average engagement time per user across the various event types.
This makes it easy to see how long people read and scroll through your articles, as well as the video views. You can also see which articles encourage file downloads, outbound clicks and site searches. Each page is shown with the number of page views it received. The total engagement time is not shown, but the metric is used to filter out your less engaging page — those with less than 1/100th of the most engaged page.
All of the analysis is automated by the Analytics Edge macro — you just need to enter your account reference name and web property (the ID number or name) and click Refresh All. The macro is easily edited should you want to change the analysis in any way.
Requires: Analytics Edge Core Add-in (premium license) with Google Analytics Pro connector
Download the workbook: User Engagement Analysis-1-0.xlsx