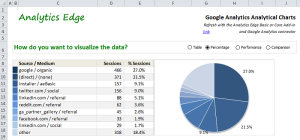
 This free workbook show how easy it is to mimic the alternating presentations of data as seen in the Google Analytics web interface. Simply click the top radio buttons to switch between table, pie chart (percentage), bar chart (performance) and relative to average (comparison) views.
Requires: Analytics Edge Core Add-in(free license) with Google Analytics connector
Download the workbook: GoogleAnalytics-Analytic-Charts-3-0.xlsx