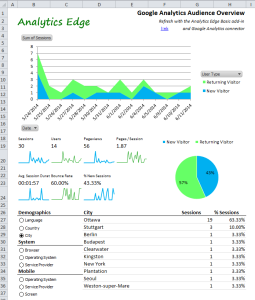
 This free Excel workbook provides a quick summary of your website’s audience over the past 30 days, just like in Google’s web interface!
See the trends and totals for all the key metrics of Sessions, Users, Pageviews, Pages/Session, Avg. Sessions Duration, Bounce Rate and % New Sessions. Compare new and returning visitors day by day as well as a summary pie chart.
The bottom section is interactive! Click one of 9 dimensions and see the top 10 items: Language, Country, City, Browser, Operating System and Service Provider. You can even check out the Mobile (and tablet) Operating Systems, Service Providers and Screen Resolutions. Each listing includes a percentage of the total sessions (% of total mobile sessions for the mobile metrics).
Requires: Analytics Edge Core Add-in (free license) with Google Analytics connector
Download the workbook: GoogleAnalytics-AudienceOverview-3-0.xlsx