 This article describes the steps I went through to build a working prototype; it is light on process and documentation because this is an educational article, not a technical how-to article. More
Helpful Articles (filter at right)
1 Welcome to Analytics Edge
Analytics Edge makes it easy to get your data into your spreadsheet. You can place multiple queries anywhere in your workbook. More
2 Help Resources Available
The Analytics Edge help site has plenty of resources available for learning and assistance with reporting. This article explains what is available and highlights the ‘account not found’ problem people experience when sharing workbooks. More
A Programmer’s Guide to Analytics Edge No-Code Macros
If you’ve written a few lines of script and aren’t afraid of words like “variables”, this guide will get you going quickly with Analytics Edge macros. Even if you’ve just played with a few Excel formulas, you might surprise yourself with how much you can do with Analytics Edge macros and how FAST it gets done! More
Account Deletion
To delete a saved account from Analytics Edge products, open the Accounts wizard for the service/connector involved, select the saved account from the list, and click the delete button. More
Account Reference Names
Analytics Edge takes account security very seriously. When you use the add-in or one of the connectors to access one of your accounts, the product will encrypt a security token and save it to your computer. You will be asked for an account reference name for this token. More
Active table in memory?
 What is this green worksheet with the message “ANALYTICS EDGE – active table in memory…“? When you are editing a query or stepping through an Analytics Edge macro, a green worksheet (ᴁ Step Results) will appear. This temporary worksheet shows you what it is currently in memory — the results of the last function step — before you formally write it out to a worksheet.
Add-in: Call VBA From A Repeating Macro
Let’s say you have an Analytics Edge workbook that uses a Repeat Macro function to loop through several web properties, each writing to a separate worksheet. Since Analytics Edge doesn’t help you with worksheet formatting much, let’s say you whipped up a little VBA code to do it. How would you integrate that VBA code into the Analytics Edge macro? More
Add-in: Changing Dates in Multiple Queries
If you are build a report that includes multiple queries and you want to be able to change the dates of all the queries at once, there are a couple of ways you can get this done — with a little pre-planning, or a little hacking. More
Add-in: Hacking the Query Worksheet
The Analytics Edge Add-in allows you to place Quick Queries anywhere in your workbook, but all those queries can be edited in a single place: the ‘ᴁ Analytics Edge Queries’ worksheet. Caution is strongly recommended–make a backup of your workbook before you start! More
Amazing SEO Reporting In Excel
With Analytics Edge and the connector for Google Search, you can quickly create SEO analysis reports with tremendous insight potential; way beyond what you can do in Google Search Console itself! Done in minutes with no formulas or programming ! More
Analytics Without Programming
Avoid complex Excel formulas; Analytics Edge lets you build reports in Excel without complicated formulas or programming. Using a simple wizard interface, this small Excel add-in lets you combine, calculate, split, pivot, sort, filter and much more. Try it yourself and see how easy it is! More
Annual Reporting Challenges
It’s that time of year again, time to summarize the performance of your website, search engine optimization efforts, and campaign spending. As you start your marathon of data manipulation, there are a few things you should keep in mind to avoid disaster. More
Building a Google Search Report: Macro Capabilities
 This article explains what is possible using the Analytics Edge macro capabilities. It pulls in Google Search data for your website pages and produces a report showing the totals and top queries for your popular pages. More
Calculating a Weighted Average (Average of Averages)
A common reporting challenge in Excel is merging sets of data, such as combining monthly numbers for a quarterly or annual total. Adding up simple metrics is obvious, but what do you do with things like the average position or conversion rate? [Hint: you should not average or total anything that is already an average or ratio] More
Combining Google Search Console And Google Analytics Data
Easily combine data from Google Search Console with Google Analytics 4 — Analytics Edge makes it easy. More
Constant Contact: Automated Email Campaign Reporting
 Several Constant Contact Solution Providers use the Analytics Edge Add-in for Microsoft Excel to automate their clients’ campaign reports. More
Constant Contact: Autoresponder Reporting
Constant Contact offers some simple reports on your autoresponder campaigns, but little detail is available. Even through the API, the data is difficult to extract, but it can be done. This article details how Analytics Edge makes it possible to monitor your email series to see who each message was sent to, which ones bounced, whether they were opened, and whether they clicked on a link.

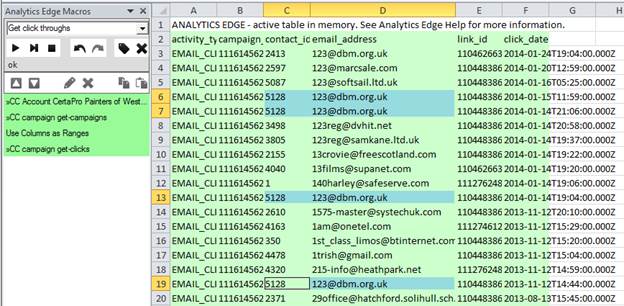
Constant Contact: Click-Through Data
Downloading Constant Contact click-through data for multiple clients has never been easier than with Analytics Edge and the Constant Contact connector. This article describes the process in detail, so you can get the job done fast! More
Constant Contact: Click-Through Data Analysis
 In a follow-up to Downloading Constant Contact Click-Through Data, this article shows how Analytics Edge can easily turn the raw downloaded data into meaningful analytics without a lot of work or confusing formulas. More
Constant Contact: Email Cohort Analysis
This article explains how to build a cohort analysis report in Excel using the Analytics Edge Add-in with the Constant Contact connector. Cohort Analysis lets you see how one group of subscribers behaves differently from another. More
Constant Contact: Getting Started With The Connector
To get started with Analytics Edge and the Constant Contact connector, you need to install and register an Analytics Edge add-in. Then the Constant Contact connector needs to be installed — it will automatically activate a 30 day trial for you. More
Constant Contact: Reporting Automation
 With Analytics Edge, your reporting gets a whole lot easier with single-click refreshes, and you don’t lose any of the flexibility that makes Microsoft Excel so popular for Constant Contact analytics reporting. Here’s an example of one engagement that went from idea to “This is AMAZING!!” in 24 hours. More
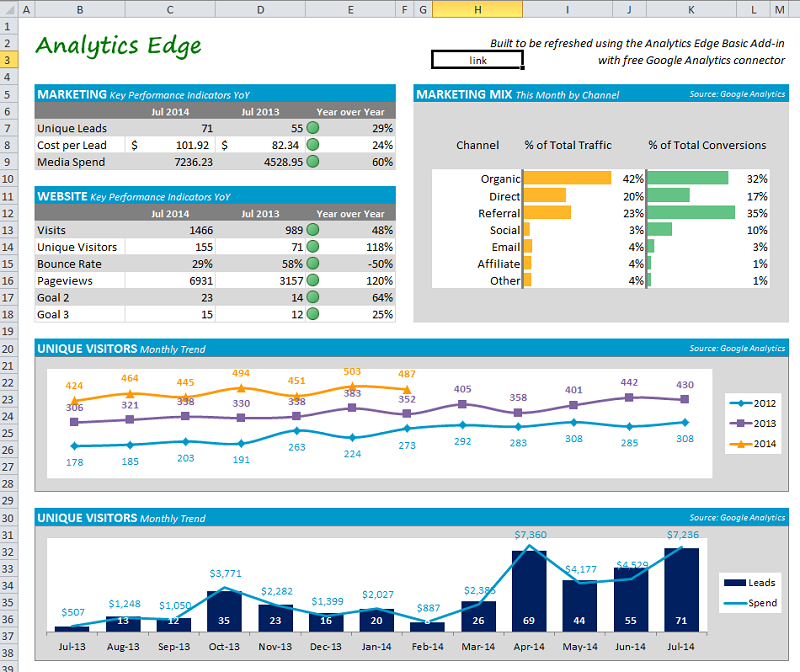
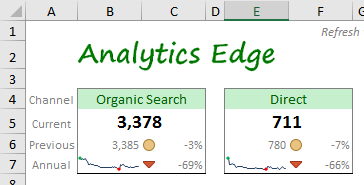
Creating an Excel Dashboard KPI Card
Creating a dashboard KPI/metric card or widget in Excel can be quite simple — it’s really just a matter of downloading the right data and some easy formatting techniques. Layout is your challenge, but even that can be overcome. This article discusses 3 ways to build a widget for your Excel report.
Data Sampling Problems In Annual Reports
Google Analytics uses statistical sampling to improve responsiveness for large queries. There is nothing wrong with statistical sampling — it will usually produce numbers close to the actual, but not always. More
Error: 400 AuthorizationError CUSTOMER_NOT_ACTIVE
This Google AdWords API error occurs when you try to query an old account that has not been active in over 15 months. The API will not permit queries to inactive accounts. This usually occurs in agencies with long account lists, some of which are old and no longer used. More
Error: 401 authError Authorization
This Google Analytics API error indicates that the security token for the account you are using has failed. Normally the security tokens are auto-renewed, but if you changed the account password or otherwise changed your security settings, the renewal can also fail. More
Error: 403 User does not have sufficient permissions for this profile
This Google Analytics API error indicates that the account you are using cannot access the Google Analytics view (profile). This usually happens when the Google Analytics account owner removes your access (a typical agency problem). More
Error: 503 There was a temporary error
This Google Analytics API error indicates that there was a problem processing your query request. This can occur if you make too many bad queries in a short period of time, or if you use use up your quota for the day. In some cases, it may indicate that the server was too busy to process your request (usually for a very large query). More
Error: Account not found. Check Account wizard
This error usually occurs when you share workbooks with coworkers, or after a computer move or rebuild. Analytics Edge stores a reference to the account in the workbook, but the actual security tokens are stored on your computer. More
Error: Invalid/missing dates
This error usually occurs when the cells you referenced in a query have moved or the contents are changed. Analytics Edge connectors offer the ability to use cell references for the dates, but the references can get out of alignment if you add rows or columns in the worksheet, or if you renamed the worksheet. More
Error: License issued to a different computer?
Analytics Edge is licensed by computer, so the add-in keeps track of the computer it is licensed for. Sometimes a Windows Update or hardware change will mess up the license, and you will get an error saying “License issued to a different computer”. More
Facebook Ads Bidding and Budgets
The Facebook Ads bidding and budget information may seem to work in mysterious ways, especially when you are trying to generate a report from the API. Here is a picture of how it fits together. More
First Looks: Google’s New Search Console API
The long awaited Google Search Console (Webmaster Tools) API update is finally out, and here’s a quick review of some of the new capabilities and limitations. More
Formatting Notes
Once installed and registered, the Analytics Edge Add-in can be used to quickly refresh multiple queries in your workbook. Simply select a destination cell and make a query, then repeat. More
Google Analytics 4: Building the Google Analytics Traffic Dashboard
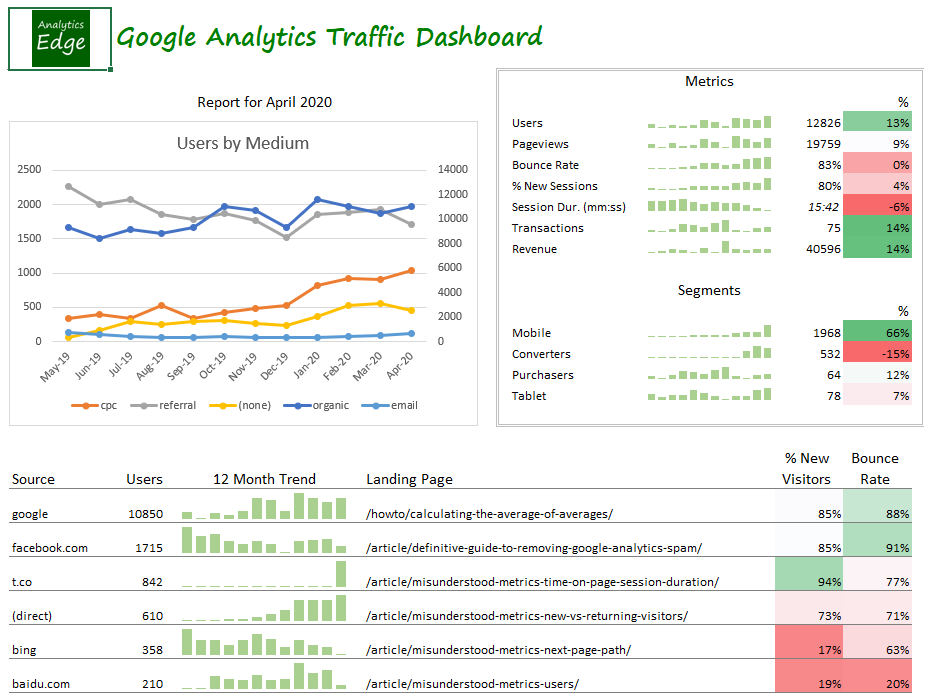 This article describes the steps taken to build the Google Analytics 4 Traffic Dashboard report with the Analytics Edge Add-in for Excel. It follows the approach described in the article Building a Marketing Dashboard in Excel. More
Google Analytics and Search Console data for Power BI
 Power BI can use CSV or Excel files as a data source and Analytics Edge can automate the refresh of those files. This combination provides a few benefits over the typical cloud-based connector solutions like Windsor.ai or Supermetrics: More
Google Analytics: Building a Multi-Site Report
With the Analytics Edge Add-in for Excel, you can easily build a multi-website report, quickly and without programming. This article and the attached sample workbook show how easy it can be. More
Google PageSpeed Insights API: No Connector Required
Google’s PageSpeed Insights API reports on the performance of a page on both mobile and desktop devices, and provides suggestions on how that page may be improved. The service works with a simple URL request and requires only a static API key for volume use. The Read Text/Web File function in the Analytics Edge Add-in lets you make these types of web queries — no need for a special connector.
More
Google Search: ABCD Categorization Report
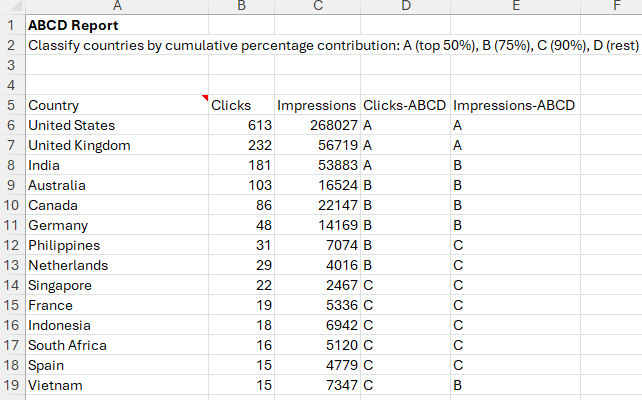 When you are looking for a simple way to categorize items, a simple technique is to use cumulative percentage contribution, which is commonly used to demonstrate the Pareto Principle (80/20 rule). In this case, we create 4 simple categories, A, B, C, and D, that each correspond to a percentage. More
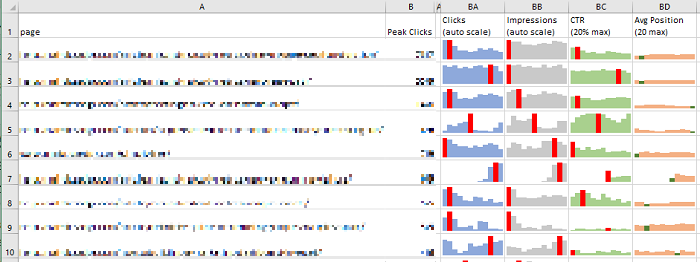
Google Search: Active Pages Report
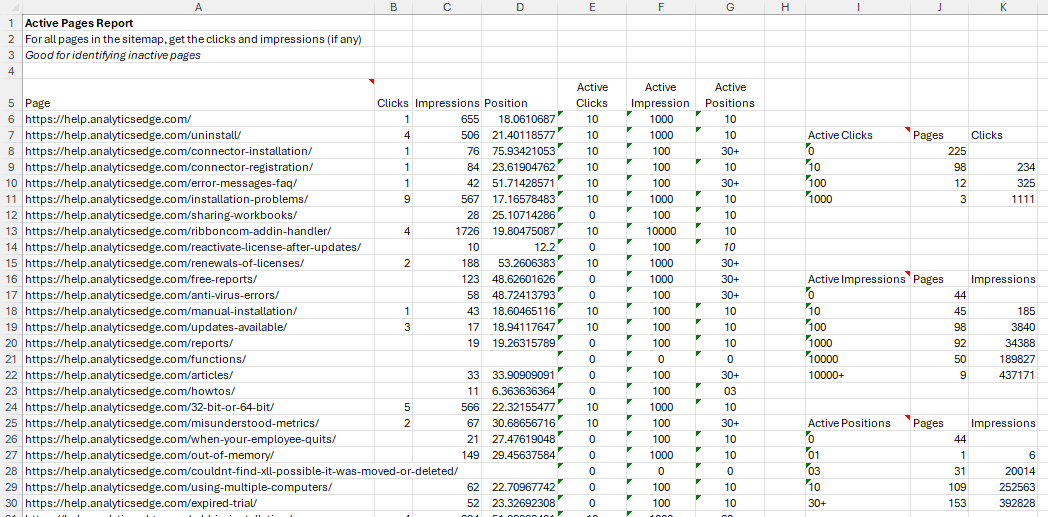 Google Search Console can only report about pages that appeared in search, but your sitemap contains all the pages on your site. This report combines the two to show which pages are active in search, and those that aren’t. It also summarizes how many pages had zero clicks and zero impressions as well as in various positions. More
Google Search: Annual Reporting
Long-term reporting with Google Search Console data is fraught with challenges. This article discusses some of the unique problems time can create, and how Analytics Edge products can save you time while solving them. More
Google Search: Brand vs NonBrand Weekly Report
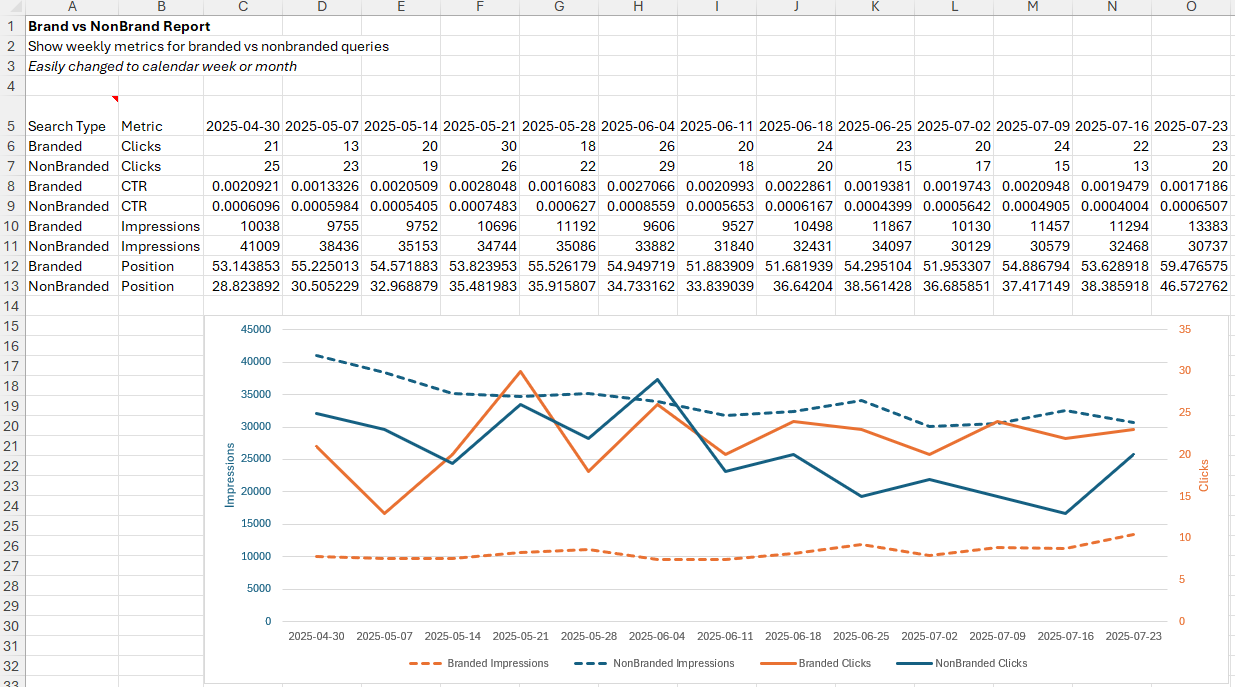 This report combines branded and non-branded Google search results into a single table for easy comparison charting, pulling data from the Google Search Console API with Analytics Edge. It demonstrates how Analytics Edge makes multiple data transformations simple so you can quickly get the data in the format you want. More
Google Search: Branded Versus Non-Branded
The filtering capability in Google Search Console is very restrictive (single phrase match), making it useless for separating branded from non-branded search terms in all but the simplest cases. Enter the Analytics Edge Add-in — a quick regular expression filter and your work is done. More
Google Search: Branded vs Non-Branded for Large Sites
If you manage several large websites, the Analytics Edge Add-in allows you to build an efficient template for separating branded and non-branded search queries from the Google Search connector. More
Google Search: Bulk URL Index Inspection Queries
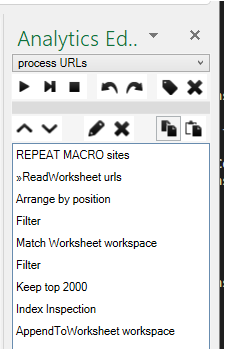 if you manage a large number of Search Console accounts and sites, this workbook will help you cope 2 big hurdles: the 2000-URL per day limit, and aligning which account to use for each URL. More
Google Search: Cannibalization Report
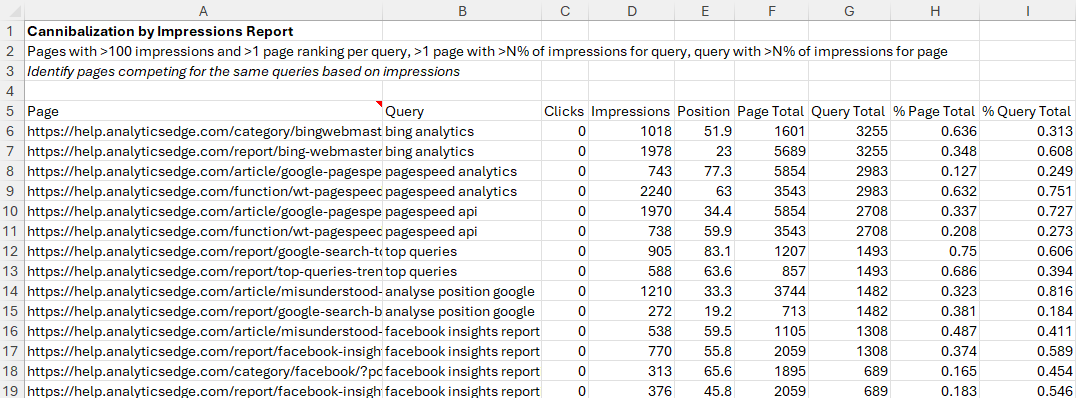 This report shows pages that are competing for clicks (or impressions) for the same query. When there are multiple pages with similar content appearing for the same query, they can ‘cannibalize’ each other, reducing their effectiveness in search. More
Google Search: Causal Impact Report
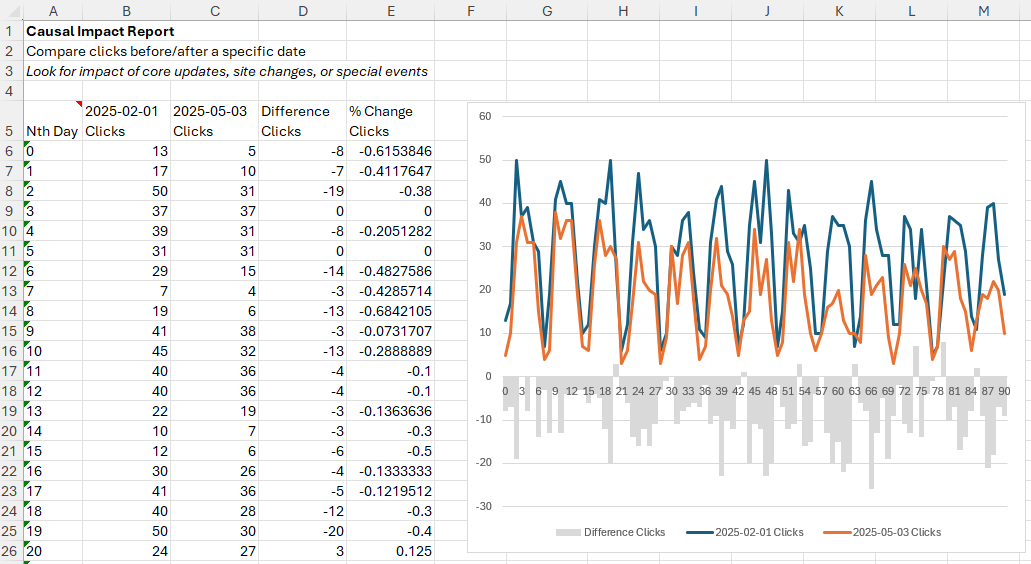 What happened to Google Search performance before and after an event? Analytics Edge makes it easy to compare 2 date ranges in Google Search. This report shows a very simple example. More
Google Search: Classify Pages Report
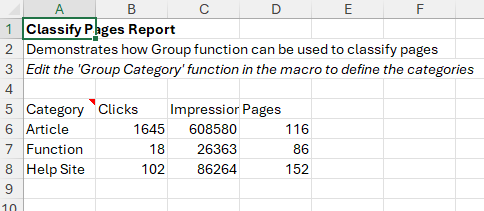 This report shows how easy it is to classify or categorize a group of web pages with Analytics Edge and compare the search performance of each group. More
Google Search: CTR Yield Curve Report
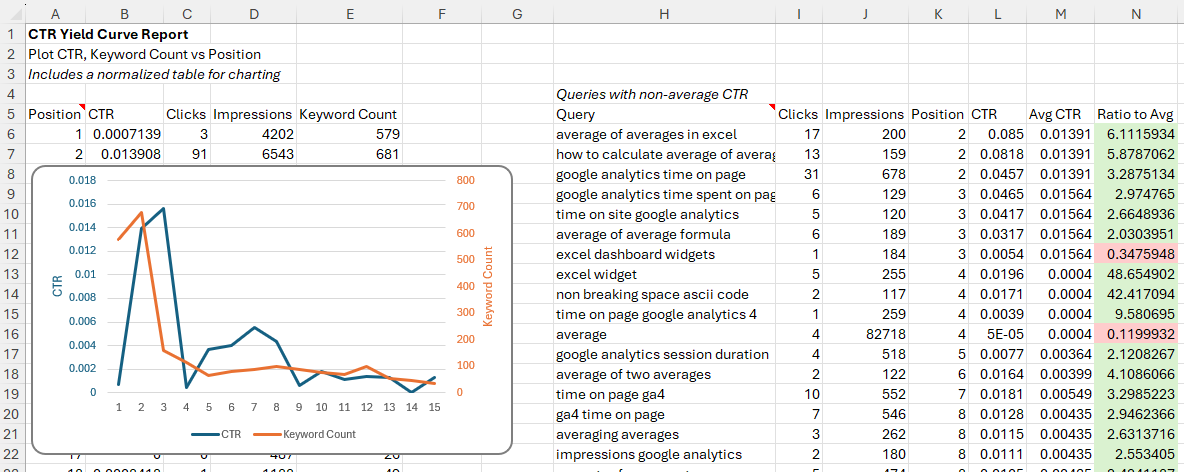 Plotting click-through-date against position lets you confirm the effect of position on your content’s performance in search. This Analytics Edge report shows you both how CTR changes with position, but also how the keyword count varies as well. More
Google Search: Directory Summary Report
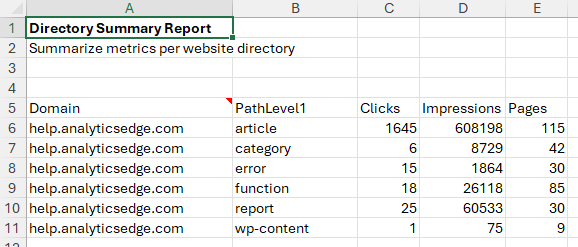 This Analytics Edge report quickly summarizes the Google Search Analytics performance of your website by the primary subdirectory. More
Google Search: Download All Your Page And Query Data
Downloading your Google Search Console data into Excel is easy with Analytics Edge. The Google Search Connector uses the API to pull down all of the query and page metrics — without the 1000 or 5000 row limit imposed by the web interface. More
Google Search: Eliminating Noise
As discussed in a companion blog article, while trying to create an annual report for my own websites, I discovered that Google Search data is full of ‘noise’ — data that actually makes it harder to make useful observations about trends. This article includes the workbook I used.
Google Search: Find Content Decay Report
 This Analytics Edge report quickly surfaces content that significantly dropped in search performance over the past month. More
Google Search: First Found Date Report
 This Analytics Edge report lets you see how new content is performing in Google search, or when old content starts appearing again. More
Google Search: Get 16 Months Of Search Data
The Google Search API now supports a full 16 months of historical data, but the only date-related field is ‘date’, so this is how to get all that data out in a meaningful way — in weekly or monthly buckets. The Google Search Connector from Analytics Edge provides a MultiQuery tab that does just what you need, and your appears in Excel in seconds! More
Google Search: Last Day of Data May Not Be Accurate
According to a tweet by John Mueller of Google (2017-06-23), the most recent day of data from the Google Search Analytics API may contain partial results, so you should plan to refresh that data the next time you run your report. More
Google Search: Pages Lifespan Report
 How many pages appear in search vs how many days do they appear — i.e. their lifespan in search? This Analytics Edge report answers the question. More
Google Search: Pages Not In Sitemap Report
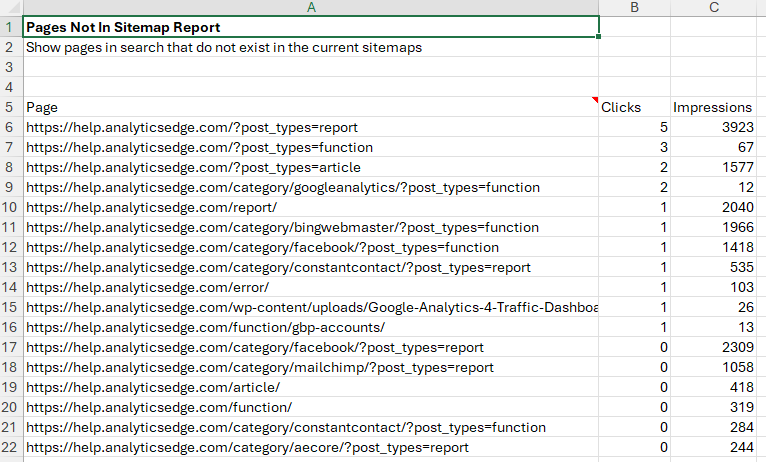 This Analytics Edge report shows the pages on your site that appear in Search Analytics reports even though they are not in your sitemaps. More
Google Search: Pages Per Day Report
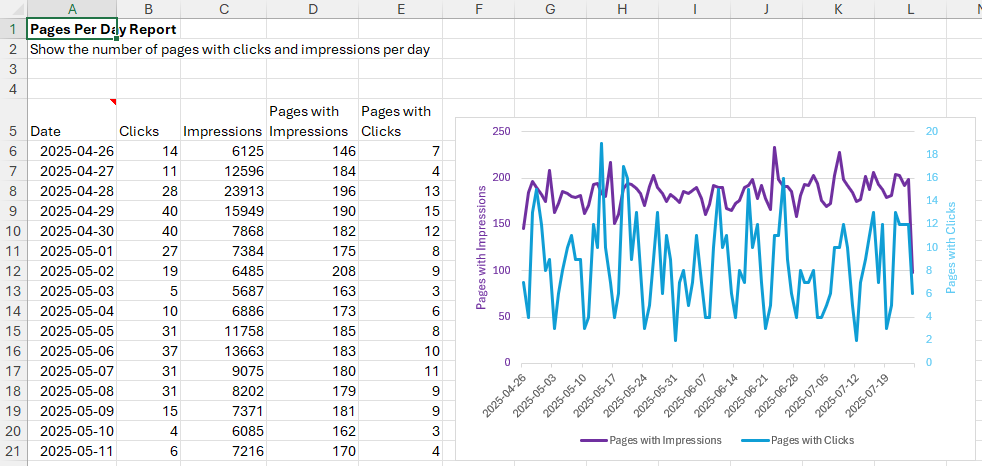 How do the number of pages appearing in search change over time? What about just the number of pages with clicks? This Analytics Edge report shows it all. More
Google Search: Trends Reporting
With the Analytics Edge Google Search connector, you can easily get week-to-week or month-to-month reporting in a single query. More
Google Search: Unique Queries Per Page Report
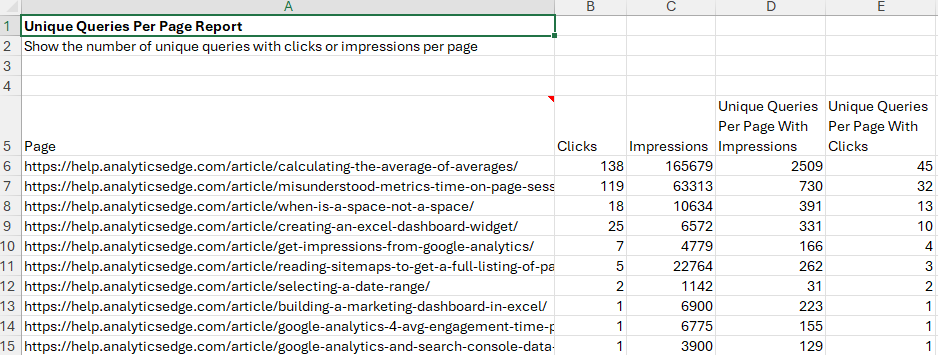 This Analytics Edge report shows how many unique queries were associated with your page in Google Search. It also shows how many actually led to clicks. More
How To Add Row Numbers
There are times you want to see row numbers in your results — a cumulative count column starting at 1 and increasing down the column. A combination of two Analytics Edge macro functions makes this possible. More
How To Build a Report Using Fiscal Weeks
Building queries based on calendar periods is pretty straight forward, but when challenged to build a report using fiscal periods, the Analytics Edge cell references can to be used to get any fiscal period you need. The magic is figuring out a series of Excel formulas (or just manually entering them) for the fiscal dates. More
How to Schedule Email Delivery of Reports
The Analytics Edge Add-in allows you to fully automate the refresh and delivery of report by email on a schedule of your choosing. It involves several steps:
- setup your email server options
- create the report you want to send
- add a macro with a Save/Email PDF or Workbook command
- schedule the report to run
How To: Email Campaign Domain Analysis
 Find out how your email campaigns are performing with particular domains, so you can see which ISPs your subscribers use most often, and detect if you’re having delivery or compatibility problems. More
Incremental Report Updates
I f your monthly report is regularly pulling down a full year’s worth of data, it is probably downloading 11 months of data that hasn’t changed. You can speed things up by doing an incremental update — just download the data you need. More
ISO Week Reporting
When a connector (API) does not offer the ability to make weekly reports based on international or ISO weeks (Monday to Sunday), you can use the Analytics Edge Add-in‘s Repeat Macro functionality to fill in the gap. More
Life Lesson: Simple Solutions Are Often The Best
In this series, I am sharing some of the stories that have shaped who I am, how I run my business,
and the products I have designed. I hope you can benefit from them as well. More
Long-Tail Keyword Analysis (Advanced Example)
Long-tail keyword phrases are often made up of many different combinations of similar words, making it difficult to tell when there is a common topic of interest. This article walks through the creation of a keyword analysis report, based on weekly snippets of data from Google Search Console. More
Making a CTR versus Position Chart By Device
The Analytics Edge Add-in is perfect for doing a quick analysis of search engine ranking data. In this article, I show how to get a CTR versus Position chart by Devices — showing the difference for click-thorough-rate of desktop versus mobile. More
Manually Scheduling a Refresh
If you want to refresh a workbook more than once a day, or if you simply want to control the refreshes yourself, this article shows how the Analytics Edge Add-in interacts with the Windows Task Scheduler app. More
Misunderstood Metrics: Facebook Insights
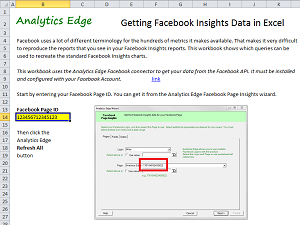 It can be confusing to download your data from Facebook Insights and try to recreate some of the online reports, only to discover the metric names don’t match. More
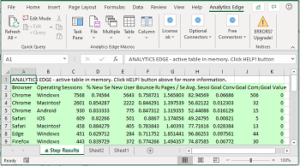
Misunderstood Metrics: GA 4 Bounce Rate
What is the bounce rate in Google Analytics 4? Is it better to be higher or lower? What is typical? Does it affect my search engine rankings? Here is some insight into this commonly misunderstood metric. More
Misunderstood Metrics: GA 4 New vs Returning Users
Confused by the new and returning users metrics in Google Analytics 4? Did you know that the “Returning Users” number in the online reports could be wrong? No wonder you were confused…
More
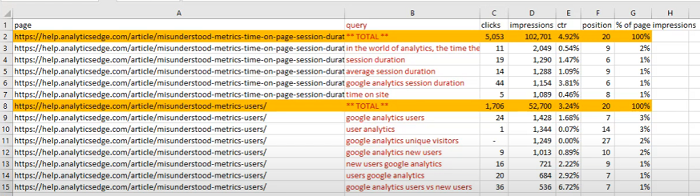
Misunderstood Metrics: GA 4 Time on Page / Session Duration
Time on page and session duration are old metrics from the early days of web analytics. You can find the equivalent in Google Analytics 4, but I don’t recommend using them as they are fundamentally flawed as explained below. User engagement is what you should be focusing on in today’s web metrics, so User engagement/Total users is the preferred measure.
Add this calculated metric to your property so you can include it in your reports.
Misunderstood Metrics: GSC Average Position
Google Search Console makes it easy to track the position of your website pages in Google’s search results, but the numbers are averages, and averages don’t tell the whole story. When it comes to search engine ranking, they can be really misleading. More
Multi-Source Waterfall Report
The wizard-based automation provided by the Analytics Edge Add-in for Excel makes it easy to combine data from multiple sources. This article explores how you can build a Waterfall Report that includes data from Google Webmaster Tools (now Google Search), Bing Webmaster Tools, Google Analytics and an external database. More
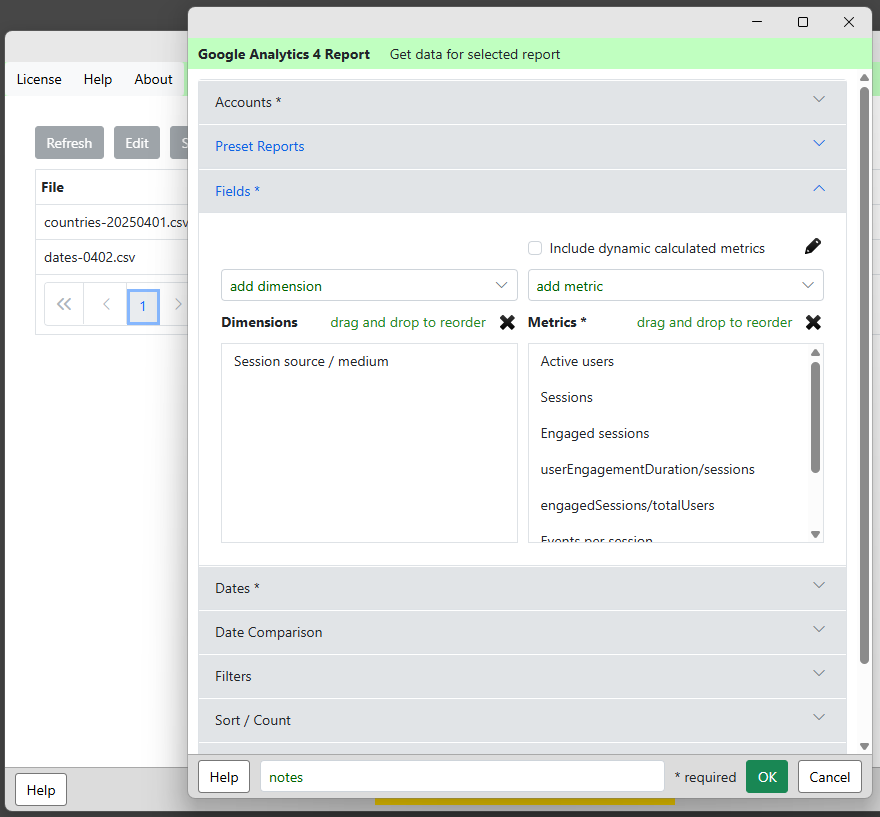
Multi-View Google Analytics 4 Queries
The Analytics Edge connector for Google Analytics supports multiple property queries when used in combination with the Analytics Edge Add-in. More
New sign-in from Internet Explorer on Windows
If you just logged into Google Analytics from the Analytics Edge connector, you may get a warning email from Google, confirming the action you just took. More
Optimize Search Engine Rankings
How do we monitor and optimize our website presence and increase our search click-through rates? More
Over 700 Filters for 12 Fiscal Months
Case Study: the client has over 700 different product groups and we need an annual report of organic search traffic to each one. Oh, and they use fiscal months, not calendar months. When faced with a challenge like this, you have a choice: should you just brute force your way through it, creating a unique query for each product and fiscal month? Or should you spend the time building a solution that is more automated, using macros and lookup tables to get the job done? You may want to stop and consider a few things before choosing… More
P25 and P75 Aggregations
 New “P25” and “P75” aggregations options have been added to the Combine, Duplicates, Lookup, Pivot, Subtotal and Total functions. More
Please reduce the amount of data you’re asking for
When the Facebook Ads API returns an error 500, it is usually telling you that the combination of the number of metrics and rows of data being asked for is too large for them to process all at once. You may hit the limit around 1000 rows, or it could be higher or lower depending on the number of columns you are asking for. More
Problems With A Macro? How To Get Help
If you have problems developing a macro in Analytics Edge, I am here to help [support@analyticsedge.com]. Two things will make the process faster and more effective. More
Reading Sitemaps to Get a Full Listing of Pages
When analyzing website traffic, there are times you might want a full listing of the website’s pages…even those that never get any traffic or impressions. Google Analytics and Google Search Console will only report on pages were there is data, so these unrecognized pages continue to be overlooked. This article shows how the Analytics Edge Add-in can read the website’s sitemap files to extract a full listing of pages. More
Running Macros from Buttons
The Analytics Edge Add-in can run a specific Analytics Edge macro from a button on your worksheet. More
Running Macros from VBA
With Analytics Edge Add-in, you can run an Analytics Edge macro (e.g. “MyMacro”) from Visual Basic for Applications (VBA), using code More
Running Queries from Buttons
With the Analytics Edge Add-in, it is now possible to run a specific Analytics Edge query from a button on your worksheet (the Analytics Edge Add-in must be installed). More
Selecting a Date Range
In most Analytics Edge wizards, you can select a data range for your query. There are a large number of combinations possible, but here are the most common selections. More
Sending Excel Reports To Clients
Many analysts, consultants and agencies use Excel to create reports for their clients because it allows them to deliver a unique solution, tailored to the client’s needs. By using Analytics Edge to generate and automate the report refresh, the monthly process becomes a lot easier and doesn’t require any changes to the client’s environment. More
Simplified Core Web Vitals Reporting
Google released new guidance on how to collect and report Core Web Vitals using Google Analytics 4, but the approach makes use of some pretty complicated concepts with BigQuery. In this article, I want to show you how to make similar reports in Excel using Analytics Edge with a lot less work and complexity. More
Sistrix API Query – No Connector Needed
 The Sistrix API uses an ‘API Key’ (secret code) to authenticate their API queries; the Analytics Edge Add-in can easily automate your downloads using the ‘Read Text/Web File’ function — no connector required! More
Splitting a Column Into Multiple Rows
It may sound like a simple request, but splitting a column into rows is something you can’t do in Microsoft Excel without resorting to Visual Basic programming or using an add-in, like the Analytics Edge Add-in. More
Story: Computers Should Automate Tedious Tasks
Do you find yourself becoming a slave to the computer? That is not how it is supposed to be. This is the first of a new series of articles where I share some of my life lessons; I hope you enjoy and benefit from them. More
Terminology
The Analytics Edge Add-in uses some common Microsoft Excel terminology, but the meanings are slightly different. More
Tips for Google Analytics Reporting
Analytics Edge makes it easy to get data from Google Analytics into Excel, and here are a few tips to make it easier to build impressive reports. More
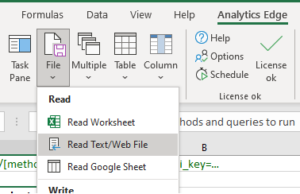
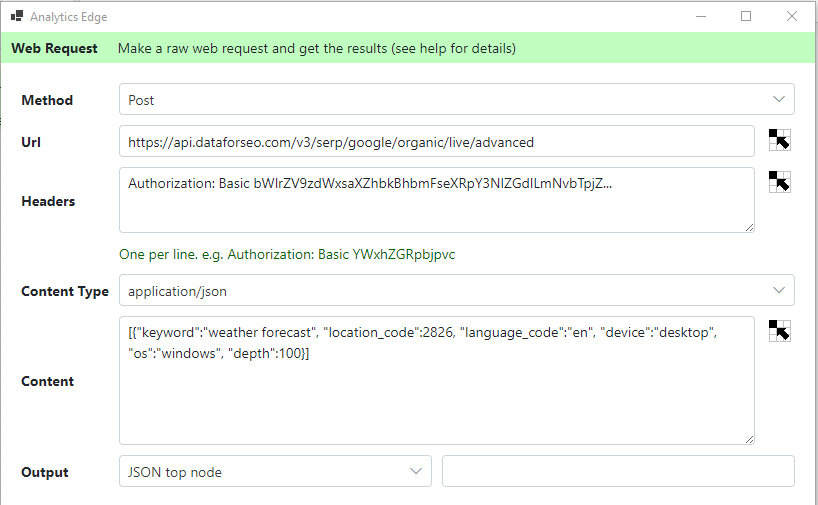
Use Web Request Function To Query DataForSEO API
This article shows how to use the Analytics Edge ‘Web Request’ function to make an API query, using the DataForSEO API as an example (a free trial of the API is avaialble). The same approach can be used for other API’s that use simple authentication schemes.
Using Append to Worksheet
The Analytics Edge Add-in allows you to append the results of a query to the existing data in a worksheet. While the function is simple, there are some scenarios where you can experience problems. This article describes the problems you could experience and the solutions. More
Using Excel Tables With Analytics Edge
It may not be obvious, but the Analytics Edge add-ins support the use of Excel Tables (and linked PivotTables). Not sure what an Excel Table is? Chandoo.org has a good introductory article to this powerful Excel feature. More