 It can be confusing to download your data from Facebook Insights and try to recreate some of the online reports, only to discover the metric names don’t match. The online Facebook reports use terminology that changes over time (remember People Talking About This?), and do not always have an equivalent downloadable metric. This makes it difficult to recreate those reports in Excel. This article, and the companion Excel workbook, shows which downloaded metrics are behind those online numbers.
The Analytics Edge connector for Facebook lets you automate the download of Facebook Insights data for your pages, but selecting the right metrics to recreate the online reports is a challenge. The attached workbook provides a mapping from each online report and the necessary Analytics Edge queries behind them.
Download the workbook: Facebook-misunderstood-metrics-v1-0.xlsx
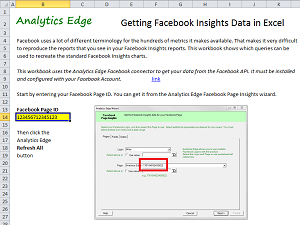
To refresh the report with your fan page numbers, install the Analytics Edge Basic or Core Add-in along with the Facebook connector. Login through the Account wizard and open the Page Insights wizard to find your Facebook Page ID number. Enter this number into the workbook on the Setup worksheet, then click the Refresh All button on the Analytics Edge ribbon bar. The connector will download all the numbers for last calendar month.
Not All Metrics Are The Same
The workbook includes worksheet tabs for each of the tabs in the online Facebook Insights reports. On each worksheet, there is an image of the online report for reference, plus all of the queries needed to get the equivalent numbers. You will note that almost all the metrics use different names.
Comments in the workbook will help you to map between what the Facebook API delivers against what the Facebook online report calls the equivalent numbers.

Some Assembly Required
Some of the numbers in the reports are the sum total or difference between two or more sets of numbers in the queries. A simple example is Net Likes, which is made up from New Likes total minus the Unlikes for the same days.
In the Visits reports, Facebook displays the top few items and groups the rest into an “Other” category. In the downloaded data, you get all the details.
The Posts reports show some metrics by the day of week, but the download just gives it to you by date.
Note that the Analytics Edge Core Add-in can Convert the date into day-of-week for you, as well as perform any necessary math or grouping of metrics.
Inconsistent Terminology
In Facebook, the term “Reach” means unique impressions, or the number of people that could have seen your content. In the online reports, they separate Organic Reach and Paid Reach, and although the API provides metrics for organic and paid unique impressions, you will find that the Organic Reach numbers actually match the total unique impressions numbers that are downloaded.
Out of Order
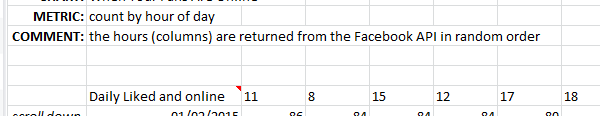
In the Posts report, Facebook provides a nice chart showing fans online by time of day, and while the numbers are available in the download by hour, they are provided in a random order. Other reports by language or country are provided in order of the largest value first, which may vary from one report to another, and one time period to the next.
The Analytics Edge Core Add-in can help here, too, using the Arrange function wizard.
Lots of Posts Means Lots of Queries
If you made a lot of posts during the month, be prepared for a lot of queries to refresh your data; Facebook’s API requires multiple queries for each post to get all the numbers required, and some of them might be off by a bit to what you see in the reports. They obviously generate the online numbers from a summary table somewhere, but they don’t provide access to it.
Not All Reports Are Time-Based
In the online reports, when you switch to the Posts or People tab, the date range selection disappears. For monthly reporting, Analytics Edge lets you pull down the metrics as they appeared at the end of the month so you don’t have to run the report exactly on the 1st of each month. Reach and Engagement metrics are for the previous 28-day period, the same as reported online.
Some Translation May be Required
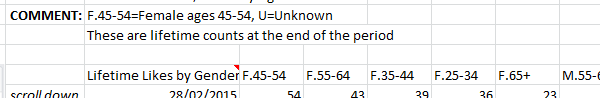
Countries and languages are reported as 2-character ISO codes, and languages are actually reported as 5-character locale codes. Demographics are mixed with separate gender and age combinations in each column (F.45-54 meaning Female, ages 45-54).
These can be converted into report-friendly names using the Analytics Edge Core Add-in‘s Replace function.
Summary
Facebook Insights reporting is made more difficult by Facebook’s inconsistent naming and encoding of the downloadable metrics. This article and accompanying workbook show how to obtain the numbers you see in your online reports. It also shows why the extra functionality of the Analytics Edge Core Add-in is needed to reproduce the online reports from the downloaded data.
Keep Learning: Other Misunderstood Metrics