This article gets you started with some simple Google Analytics reports with Analytics Edge.
Last Month’s Metrics
In this first example, let’s look at how to capture the key metrics for last month. These would typically appear across the top of a regular performance report.
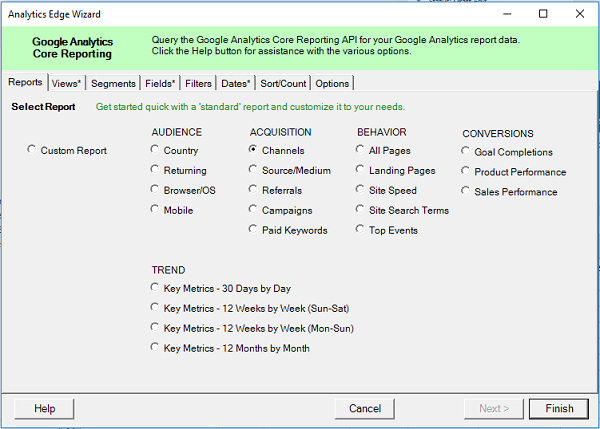
Start by selecting a destination cell, then open the Google Analytics > Analytics Reporting wizard from the Analytics Edge ribbon bar.

Core Add-in users: Click the Quick Query button.
Select the preset report for Key Metrics – 12 Months by Month.
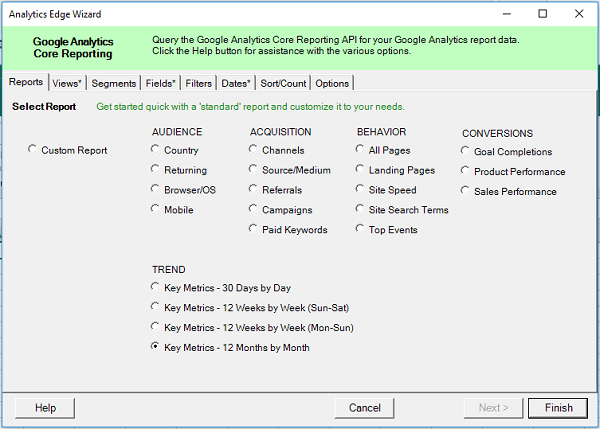
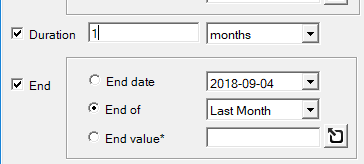
This one report can be used for last month, month-over-month, and annual reporting if desired. For a single month, just go to the Dates tab and change the 12 months to 1 month.
Click Finish.
Standard Add-in and Core Add-in users: click the Write to Worksheet button.
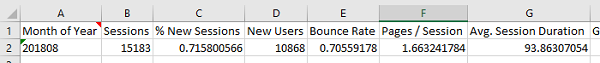
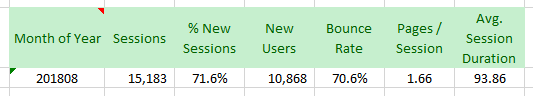
Note that the numbers are unformatted by default. You can use Excel’s formatting to format the rate and percentage cells to % format. You can also fix the number of decimals to a desired level (1 or 2 typically). Duration metrics are in seconds.
Month-Over-Month Reporting
Showing month-over-month change is a typical reporting technique, and it is just as easy. Start as above, but change the Dates from 12 months to 2 months.

Click Finish.
Standard Add-in and Core Add-in users: click the Write to Worksheet button.
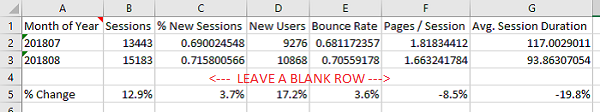
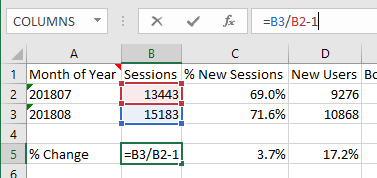
Leave at least one blank or empty row below the data, then add Excel formulas to calculate the percentage change. For example, for Sessions, in cell B5, you would enter =B3/B2-1
Note that calculating a percentage change of a percentage or rate number is a common but questionable practice. Some people prefer to use a difference of the percentages; for example if the % New Sessions changes from 69.0% to 71.6%, that would be a 2.6% change (71.6 – 69.0) as opposed to a 3.7% percentage change. Determine which convention you prefer to use and be consistent.
As above, you can format the numbers as desired. If you want to present the numbers in a more appealing manner, see Widgets in Excel.
Segment by Channel
To produce a report showing the key metrics segmented by channel, create a new query as above, but select the predefined Channels report.
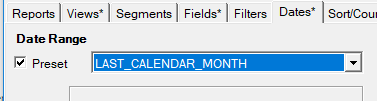
Switch to the Dates tab and change the date range as desired, using the preset Last Calendar Month for example.
Click Finish.
Standard Add-in and Core Add-in users: click the Write to Worksheet button.
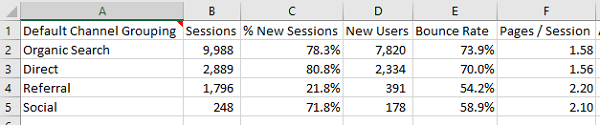
The raw numbers can be formatted as above.
Other Common Reports
The Reports tab contains a number of other typical reports that can be used. After selecting the predefined report, you can switch to the Fields tab and Add or Remove dimensions or metrics. Note that some combinations will not work together (the fields are grayed out), and there are a few that are technically OK, but will not give you meaningful numbers (like Page and Sessions).

Note that there is a Help button in every wizard, and you can always post a question to the support forum.