This article explains how to build a cohort analysis report in Excel using the Analytics Edge free Google Analytics connector. Cohort Analysis lets you see how one group of people behaved differently from another. A “cohort” is simply a group of people that share a common characteristic, such as the date they first visited your website, or whether they clicked on a specific campaign, or the people that came from a particular referral source.
Cohort Segmentation
In this report, we’ll group new users by the month of their first visit for the past 12 months. In Google Analytics, we use Advanced Segments to create our cohorts. We need one advanced segment for each of the 12 monthly cohorts. For example, all visitors whose first visit was in last February. Our analysis will follow them through the rest of the year to see what they did, and we can compare the cohorts at the end.
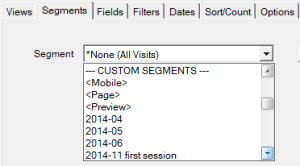 With Analytics Edge, we can use custom advanced segments defined in your account, but that would mean we need segments for each month in our report. That would be OK for a single analysis, but not for an ongoing report — we would have to modify our report every month to use a different set of predefined segments, and continuously add new segments each month. That is a lot of work and there is a limit to the number of advanced segments.

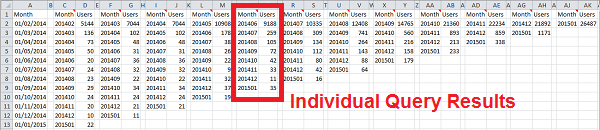
click image to enlarge
Instead, Analytics Edge can use dynamic advanced segments, where the segment is defined in the query, not in your account.
To define each of our cohorts, we would create a segment that had the Date of First Session during a particular month. Analytics Edge allows you to pick specific dates, from a list of predefined periods, or to use the value from an Excel cell reference. Using a cell reference means we can make the report automatically update as time passes.
To build our segments, we need a list of dates for each of the past 12 months in an Excel worksheet. There are a number of ways we could do this: manually enter the dates, use Excel formulas to calculate them, or create them from another query.
Building a List of Months
None of the dimensions from Google Analytics would deliver the month formatted as a date; the nearest we would get is to use Month of Year, but it would return “201402” formatted as text (or as a number), which we would need to use an Excel formula to convert. If you need a formula, It is better to just create the dates with formulas that stands alone [keep it simple].
= DATE(YEAR(TODAY()),MONTH(TODAY())-#,1) where # goes from 1 to 12
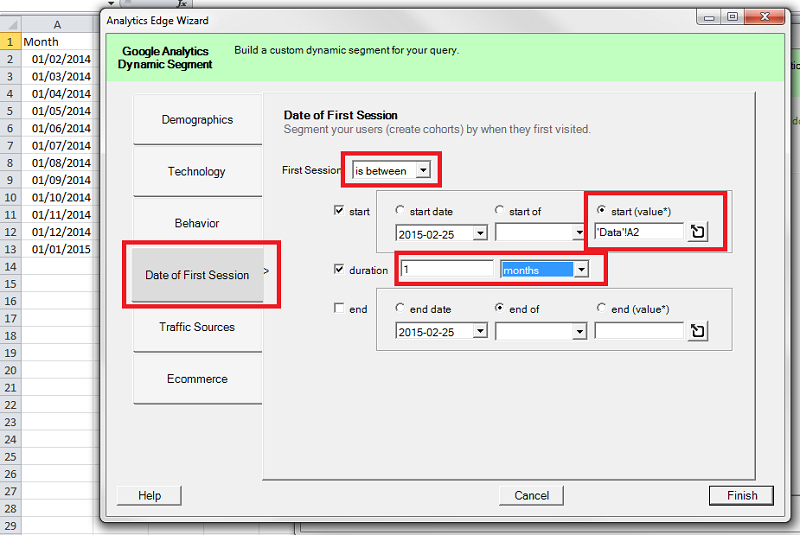 In our dynamic segment, we can use a simple cell reference to one of the dates in this list, setting the duration to 1 month. Analytics Edge will handle the details.
Now we have a segment that will limit our query to sessions from people whose first session on the site was during February of 2014 (in this example).
Measuring Users by Month
In the simplest example, we could just check Users by month to see how many people came back to the site in subsequent months. We could also track Pageviews, Goal Completions, Revenue…any Google Analytics metric you want. You could also include dimensions such as Landing Page to see if they bookmark a specific page and come back repeatedly. You can even pick a dimension to segment within the cohort, like adding Country to see if your site appeals to specific demographics better than others.
 We’ll stick to a simple example with just Users, looking to see if they keep coming back over time. As for time, lets keep to monthly buckets, so we will look to see how many visitors from our February cohort come back in March, April, May, etc.
To keep February, 2014 before January, 2015, we need to keep the year component of our date, so pick Month of Year (201402) instead of just the Month (02) dimension.
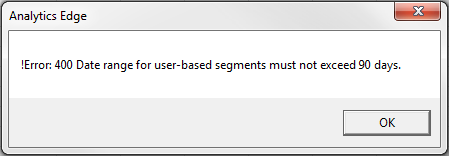
User Segmentation Limitation
When we try that query, we get an error because Google only allows a 90-day “window” into user behaviour.
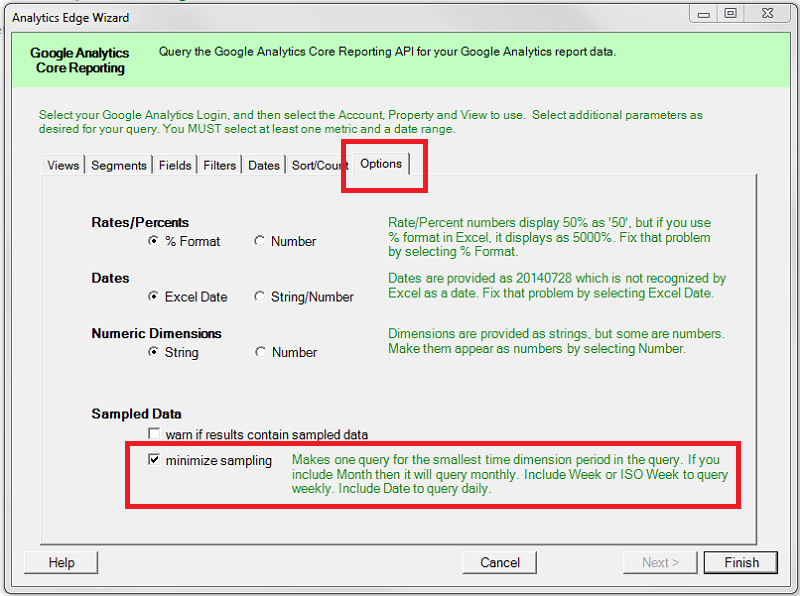 There is a way around this limit: make multiple queries of a shorter duration and join the results. That just happens to be what the Analytics Edge Minimize Sampling option does! Check the box, and we get 12 monthly queries instead of one 12-month query. Perfect!
Caution: by the time you finish the report, you’ll see this adds up to 78 queries. It may take a minute or two to refresh them all.
Copy, Edit, Repeat
To make cohorts for each of the other months in our year, we would repeat the process, creating additional queries, defining segments, selecting the dimension and metric, picking the dates, checking the sampling option. You can save yourself some time by copying the original query, pasting it to a new location (with an empty column between queries) and editing the copy. Change the cell reference for the date used in the Segment and the date in the query and save. When you finish all 12, you’ll have all the data you need for the report.
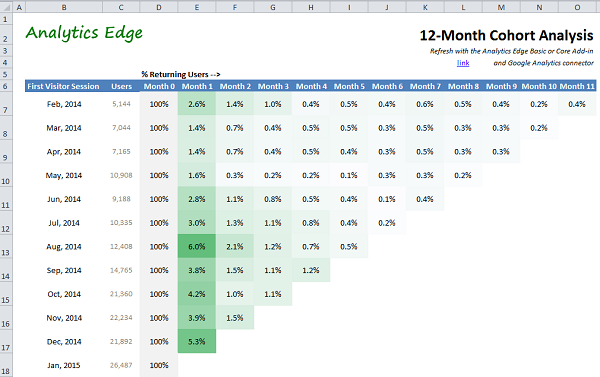
Make the Data Pretty
From this point on, it’s all Excel functionality. Build a report worksheet with cell references to the data worksheet, simple formulas to convert the numbers to percentages (users in month 1 / users in month 0), and some conditional formatting.
Download the workbook: CohortAnalysisMonthly-1-0.xlsx
Summary
Creating a cohort analysis with Analytics Edge is a simple process: define your cohorts with dynamic advanced segments, and build your queries using Excel cell references for the dates. If you have user-based segments and want to exceed a 90-day period, use the Minimize Sampling option to break the query into smaller time frames.
Analytics Edge makes the process fast and refreshes painless.