 The Analytics Edge add-in for Microsoft Excel lets you easily combine rows with identical values in some of the columns. The simple wizard interface gets the job done in seconds without programming or formulas. Use it with other Analytics Edge functions to simplify and automate your Excel reports.
Using the Duplicates wizard
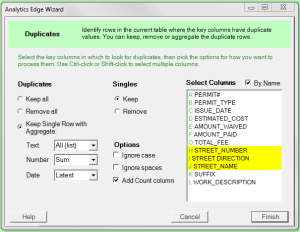
Once you have loaded your data, open the Duplicates function wizard and select the columns you want to remain unique, then select the options for how to deal with rows that have duplicates and for rows that don’t (singles). You can also choose to ignore uppercase-lowercase differences when comparing text, as well as whether to ignore spaces in the text. A final option allows you to get a Count column added to the table indicating the number of rows that were combined in the operation.
 Combining identical rows
In the simplest case, you can combine rows where all the columns have the same values — i.e. the rows are complete duplicates. You may need to do this when combining lists that may have some of the same entries.
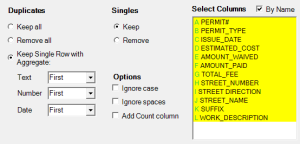
In this case, you would select all the columns (drag the cursor down the list or click on the first entry and Shift-click on the last). For options, Keep Singles rows and for Duplicates, pick Keep a Single Row with Aggregate and selectFirst for all of the data types (all the rows are identical anyways).
This functionality is the same as the Remove Duplicates function in Excel, but it can be added as part of an automation macro in Analytics Edge, and you have the easy option of adding a Count column so you can see which rows were duplicated.
 Combining rows with some duplicate values
Sometimes you want to see something like a subtotal for a few columns, but don’t want to lose the other columns of information. For example, if we have a sheet with work permits by address, we want to see all the permits for each address.
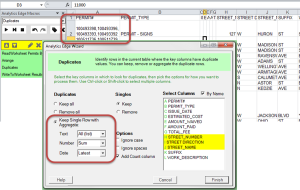
Select the columns that you want to remain unique, such as the street address columns, and then Keep Single Row with Aggregate for Duplicates. For Text columns, select All (list) which will keep all of the values from the separate rows, but they will all be listed in a single cell with commas separating them. In the example image, the original table contained 4 permits for 127 W HURON ST, so all 4 are listed in cell A2.
Note that Excel cannot show comma-separated numbers or dates in a single cell, so there is no equivalent aggregate option for those data types. However, you can get a similar list by first converting those columns to Text using the Convert wizard.
With numbers and dates, you can keep an aggregate value, which might be the First or Last, a Sum or the Latest date. What you select depends on your data and the value most useful in the results. Analytics Edge lets you choose for each data type.
Keeping only duplicates
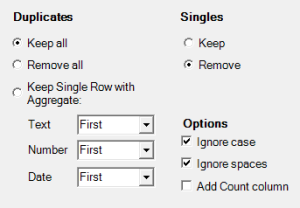
If your worksheet isn’t supposed to have duplicates, and you want to deal with any manually, you can use the Duplicates wizard to Keep allDuplicates andRemove Singles. Also check the Ignore case and Ignore spaces options. Sort the result and write them to a temporary worksheet. Now you have a list to work through, with all of the original values in each row.
This situation often crops up in Customer Relationship Management (CRM) systems, where new accounts or contacts are created with one name or address component spelled differently, of they have extra spaces that prevented an exact match when entered.
Other combinations possible
As with all Analytics Edge function wizards, you pick the options you need to suit your duplicate data challenge. This gives you the flexibility you love in Excel without the complicated formulas, so you can focus on your task, not the tool.
Simple Excel automation from Analytics Edge.
