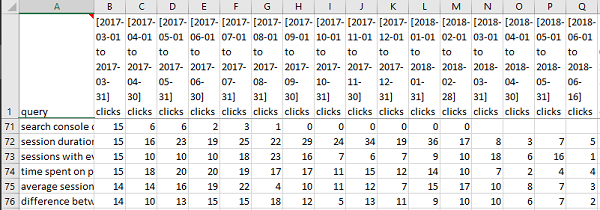
The Google Search API now supports a full 16 months of historical data, but the only date-related field is ‘date’, so this is how to get all that data out in a meaningful way — in weekly or monthly buckets. The Google Search Connector from Analytics Edge provides a MultiQuery tab that does just what you need, and your appears in Excel in seconds!

There are about 500 days of data available from the API, which is just over 16 months, but depending on when you run your report, your first or last month may be a partial month. So pick a date range of [Duration: 16 months; End of: This Month] to include this month-to-date, or shorten the timescale to 15 months and End of: Last Month if you only want to see full/complete months.

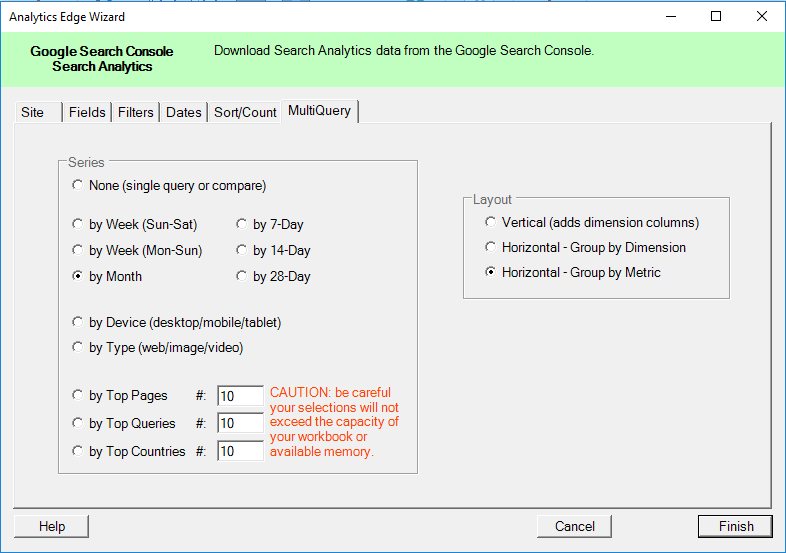
Flip to the MultiQuery tab and pick ‘by Month’. You can also pivot the data (try Layout- Horizontal by Metric). The connector will run multiple queries in parallel to get your data, so expect everything to slow down while it processes things.
Weekly reports can be generated in a similar way; just select a date range of less than 71 weeks, ending on an appropriate date, and use the ‘by Week (Sun-Sat)’ or ‘by Week (Mon-Sun)’ option. The connector will take care of the rest.

Too Much Data?
A word of caution: Excel can only handle about a million rows, so be careful how much data you ask for. Also, if you really want to play with lots of data, make sure you are running the 64-bit version of Excel or you will hit memory limits.