Google Search Console makes it easy to track the position of your website pages in Google’s search results, but the numbers are averages, and averages don’t tell the whole story. When it comes to search engine ranking, they can be really misleading.
A Measure of Central Tendency
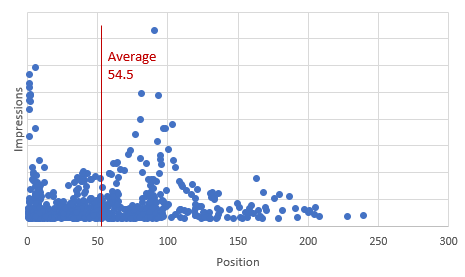
The first problem is that the position metric is an average – a mathematical measure of central tendency. It is a good measure if the underlying data tends to be around a central value.
The problem is that a website is made up of multiple pages, and some page rank high and some low. For each page, some queries might rank high and others low. In some countries, a page may rank higher than in others for the same query. What ranks high on desktop may not rank well on mobile. Mix all of those together, and you can see why the average position for a website can be a meaningless metric.
A Poor Key Performance Indicator
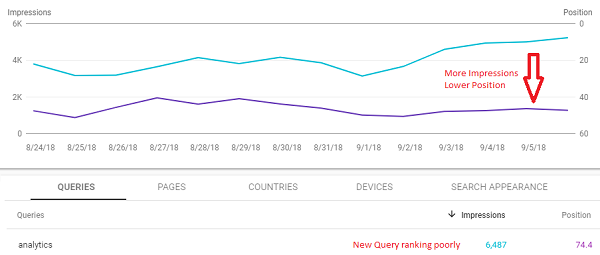
It is tempting to think that, even if the number itself if not of much value, a trend over time may provide some insight — if it goes up or down, that would be a good indicator that things got better or worse. Many people use it in dashboards as a key performance indicator, and some regret that decision later. The problem with trending an aggregate position over time is that when something good happens, the number could go up OR down.
As an example, if one of your pages suddenly starts ranking (but not very well) for a brand new a query, you would think that would be a good thing. The problem is that the average position gets worse, not better, because the lower rank of the new queries pull it that way. It is even possible the new query term is not one you want to rank for.
No Simple Answer
To understand the average position number you need to look below the metric to see what is driving it. Google Search Console provides several dimensions we can use for this analysis — the pages, the queries, the countries, the devices, and the date. You can drill down and filter within the tool, but you can also export the data or use the API to perform different kinds of analysis.
The one thing you should not do is assume that the average position is a simple metric.
Keep Learning: Other Misunderstood Metrics
Solutions from Analytics Edge
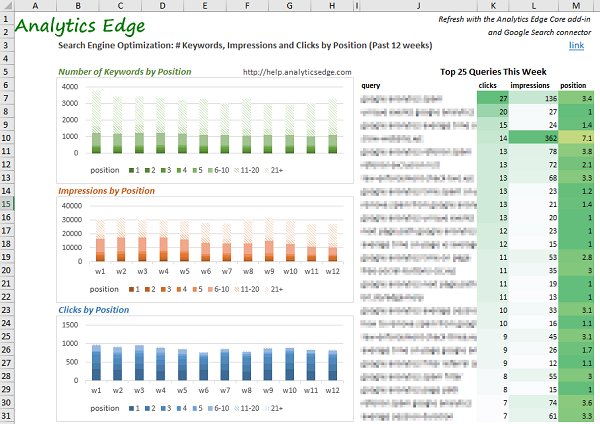
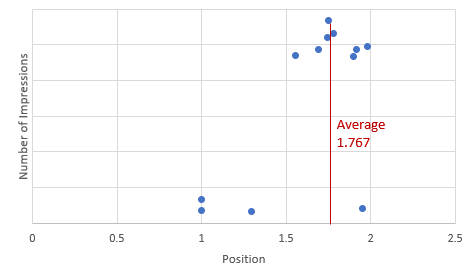
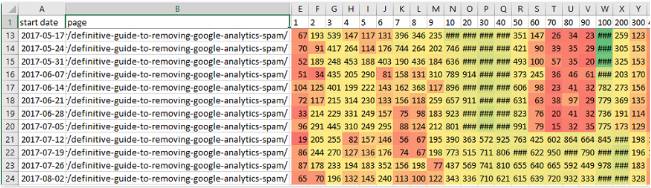
Analytics Edge has a connector for Google Search Console that can download all of your data into Microsoft Excel. Combined with the Analytics Edge Core Add-in, you can automate your analysis and produce some insightful reports. For example, you can look at the distribution of the position for each page or query term [download this report]
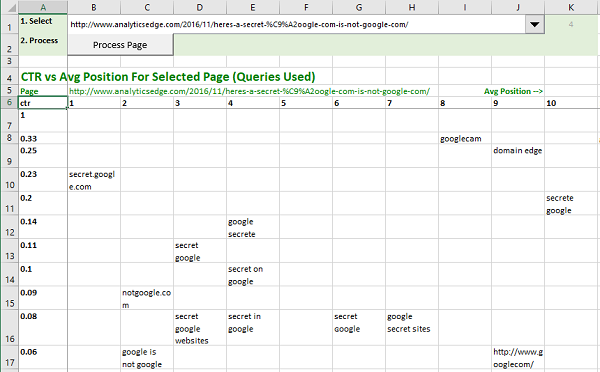
Or you could try to visualize the performance (click-through-rate and position) of various keywords for a specific page. [download this report]
Eventually you will end up with a different kind of summary report – one that suits your website. [download this report]