Time on page and session duration are old metrics from the early days of web analytics. You can find the equivalent in Google Analytics 4, but I don’t recommend using them as they are fundamentally flawed as explained below. User engagement is what you should be focusing on in today’s web metrics, so User engagement/Total users is the preferred measure.
Analytics Edge makes a no-code automation add-in for Microsoft Excel.
Download data from Google Analytics, pivot, filter, sort, combine, and more
without formulas or finicky AI; just simple wizards with one button refresh.
learn more…
Add this calculated metric to your property so you can include it in your reports.
User engagement is the time that the page is actually visible in the browser.
Session duration is the difference in time between the first and last event of the session.
Average Session Duration Has No Current Value
In classic web metrics (like Universal Analytics), the time on page measure was the time difference from when the first page was clicked to when the next page was clicked. Session duration was the total of the time on page measures for the session. The biggest problem was that the last page viewed didn’t have a next-page-click, so the time on that page was always zero. That also meant session duration was always a little low — it was actually zero for sessions with only one page view (bounces).
In Google Analytics 4, there is still an Average session duration metric. They now capture a wide range of browser events and they can now capture the time that the browser tab was actually visible to the user — measured as User engagement time. They also typically capture an event when the browser tab closes — that means the session duration now includes the classic time on page measurement for the last page, too. Also, if you view it on a page-level report, the Average session duration number actually shows you the classic time-on-page numbers. But…don’t use them…
These metrics have no real value in measuring today’s ADHD, 100-tabs-open, notification-centric, constantly-task-switching population. They could open a tab in the morning, read part of it over breakfast (while also catching up on email and social media), read a little more later in the day, and eventually look at the tab briefly 2 days later before closing it. “Sessions” no longer have meaning, and time between page clicks is almost meaningless.
It’s All About User Engagement
User engagement is the new key metric — how much time did the user actually spend looking at the page? …and the site? The User engagement metric can be included in a wide range of reports — engagement time is captured with a number of different event types. There are pre-calculated averages per view, per session and per user, but the ‘per user’ number is the preferred.
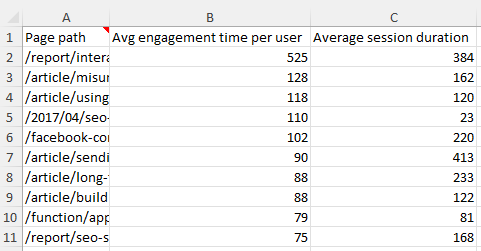
The replacement measure for ‘session duration’ and ‘time on page’ is now User engagement/Total users which can be combined with a ‘Page path‘ or similar dimension.
Note that if a user engages with a page over multiple sessions, the average session duration number will drop fast — same engagement divided by multiple shorter sessions. But if the user engages in interrupted snippets during a long session, the average session duration would be larger even though the engagement is small. You can clearly see this confusing higher-or-lower comparison when you report both numbers side-by-side on a page-level basis. Some are higher, some are lower; some are close, some are far apart. Note: longer engagement time is almost always a good thing, but session duration being higher or lower is hard to attach meaning to.
Maybe you can infer some meaning to the difference — if the average session duration is much smaller, the users came back to the content over 30 minutes later (multiple shorter sessions). That could indicate good sticky content or reference material. If the session duration is only slightly longer than the engagement time, they looked and left…once. Maybe the page answered all their questions.
A Deep Dive Into Details
Let’s look at a real session, one where the person viewed several pages and downloaded a few files. I extracted the detailed data from BigQuery and summarized it below, color-coding each of the 7 pages viewed. If you are unfamiliar with BigQuery extracts, you will notice the event-based nature of Google Analytics 4, with different events triggering based on the visitor’s behavior as they click, read and scroll through a session.
One observation up front: it looks like they opened a page listing various report articles (‘/?post_types=report’), then they open several report pages in separate tabs, downloading some of the report files, eventually closing everything. I believe they used several tabs because they start and end with the same page, but there is only one page_view event so they never left the first page — the other pages must have been opened in different tabs. At one point they seem to switching back-and-forth between two report pages (on different tabs, the numbers makes sense).

The red and green panels at the right are calculations — the duration is the difference in timestamps for each page viewed (in seconds), and the engagement is the sum total of user engagement measured for each page (in seconds). The numbers expose aflaw in the time-between-clicks approach, but we’ll get to that later.
If we get a report for this session from the API (the Add-in for Excel makes this easy), we will see this session summarized as:
![]()
Notice that the numbers are similar, but not identical (294 vs 296, and 132 vs 126). Google Analytics 4 reporting is rife with examples like this — if you take data from the standard reports, exploration reports, the API and/or BigQuery, Google has admitted there can be small differences due to how they process the data.
If we include the page path the report, we can see the duration and engagement measures are also similar to the calculated numbers on a page level. This means we can use the Average session duration metric to obtain classic time-on-page numbers.
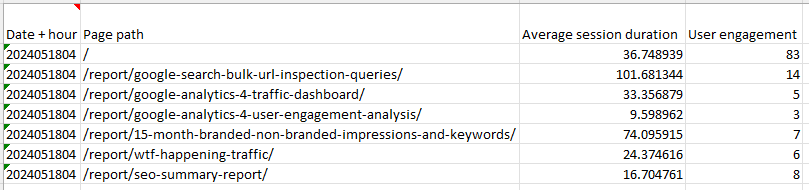
It’s time to expose the flaw in the time-on-page/avg-session-duration numbers for pages: the first page has a 36.7 second time-on-page duration, but 83 seconds of engagement. How? The user was clicking between tabs, wracking up engagement time while the timestamp difference only captured the last little bit. Time between page clicks is of little value in multi-tab browsing.
Conclusion
If you are looking for the classic time-between-clicks measures of time on page and session duration in Google Analytics 4, you can still get them in the Average session duration numbers. If you instead are looking for a measure of how much time users actually spent on your page, use the User engagement/Total users metric.
Add this calculated metric to your property so you can include it in your reports.