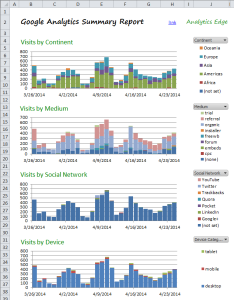
 This free Google Analytics Summary Excel Report is refreshed in seconds using the Analytics Edge Connector for Google Analytics. It includes 4 trend charts for the past 30 days, providing great visual presentation of:
- visits by continent
- visits by medium
- visits by social network
- visits by device
Click the Refresh All button on the Analytics Edge ribbon and all the queries are updated. No fussing with dates. The report uses standard Excel pivot tables and charts, so after you refresh the queries, you will need to refresh the pivot tables as well (Data ribbon – Refresh All button). You can easily modify it to suit your website tracking challenges.
Requires: Analytics Edge Core Add-in(free license) with Google Analytics connector
Download the workbook: GoogleAnalytics-SummaryReport-3-0.xlsx