Analytics Edge makes it easy to get your data into your spreadsheet. You can place multiple queries anywhere in your workbook. More
Helpful Articles (filter at right)
2 Help Resources Available
The Analytics Edge help site has plenty of resources available for learning and assistance with reporting. This article explains what is available and highlights the ‘account not found’ problem people experience when sharing workbooks. More
Account Deletion
To delete a saved account from Analytics Edge products, you can click the delete button (‘X’) beside an account selection, or if one is not provided, open the Accounts wizard for the service/connector involved, select the saved account from the list, and click the delete button. More
Account Reference Names
Analytics Edge takes account security very seriously. When you use the add-in or one of the connectors to access one of your accounts, the product will encrypt a security token and save it to your computer. You will be asked for an account reference name for this token. More
Combining Google Search Console And Google Analytics Data
Easily combine data from Google Search Console with Google Analytics 4 — Analytics Edge makes it easy. More
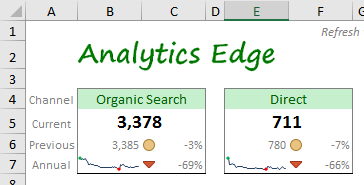
Creating an Excel Dashboard KPI Card
Creating a dashboard KPI/metric card or widget in Excel can be quite simple — it’s really just a matter of downloading the right data and some easy formatting techniques. Layout is your challenge, but even that can be overcome. This article discusses 3 ways to build a widget for your Excel report.
Data Sampling Problems In Annual Reports
Google Analytics uses statistical sampling to improve responsiveness for large queries. There is nothing wrong with statistical sampling — it will usually produce numbers close to the actual, but not always. More
Error: 401 authError Authorization
This Google Analytics API error indicates that the security token for the account you are using has failed. Normally the security tokens are auto-renewed, but if you changed the account password or otherwise changed your security settings, the renewal can also fail. More
Error: 403 User does not have sufficient permissions for this profile
This Google Analytics API error indicates that the account you are using cannot access the Google Analytics view (profile). This usually happens when the Google Analytics account owner removes your access (a typical agency problem). More
Error: 503 There was a temporary error
This Google Analytics API error indicates that there was a problem processing your query request. This can occur if you make too many bad queries in a short period of time, or if you use use up your quota for the day. In some cases, it may indicate that the server was too busy to process your request (usually for a very large query). More
Error: Account not found. Check Account wizard
This error usually occurs when you share workbooks with coworkers, or after a computer move or rebuild. Analytics Edge stores a reference to the account in the workbook, but the actual security tokens are stored on your computer. More
Error: Invalid/missing dates
This error usually occurs when the cells you referenced in a query have moved or the contents are changed. Analytics Edge connectors offer the ability to use cell references for the dates, but the references can get out of alignment if you add rows or columns in the worksheet, or if you renamed the worksheet. More
Get Impressions From Google Analytics
A lot of people want to include the clicks and impressions metrics in their Google Analytics reports, and are frustrated when they see most reporting tools do not offer those metrics. That is because they don’t actually come from Google Analytics — they come from Google Search Console, and that uses a separate API.

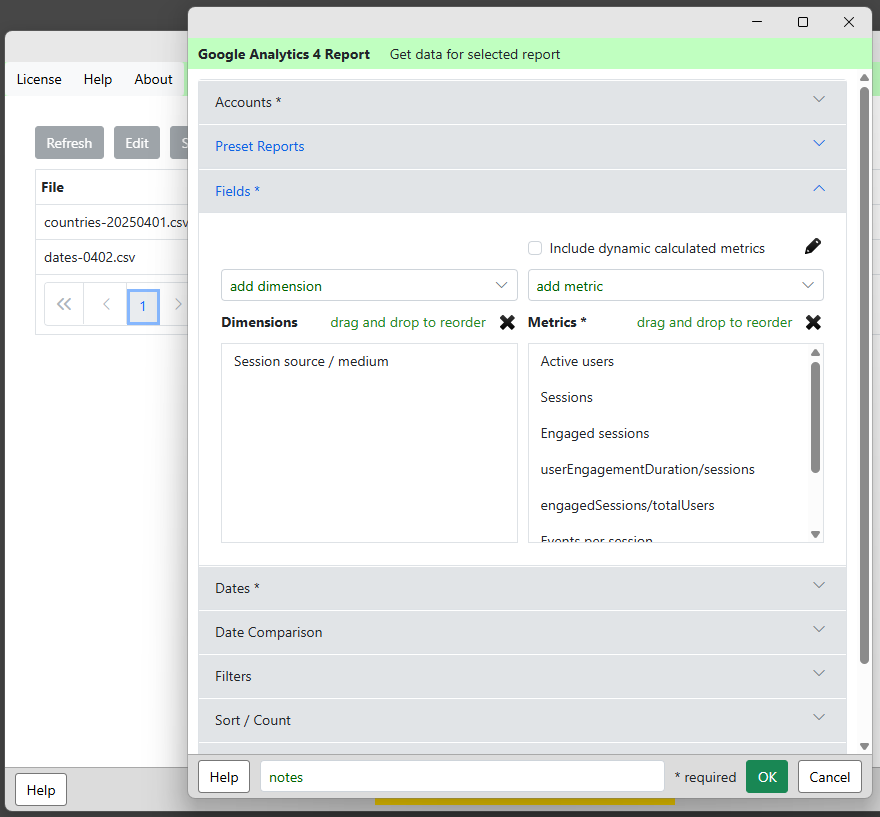
Google Analytics 4 Report Automation
Now that the Google Analytics Data API has been released, it is possible to automate your Google Analaytics 4 reporting. Analytics Edge and the Google Analytics connector makes the process easy with a powerful add-in for Microsoft Excel.
Google Analytics 4: Add Session Count Dimension
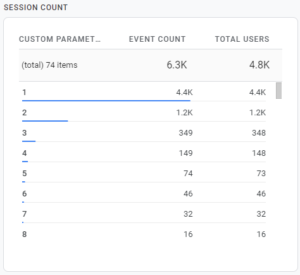 It is easy to get a Session Count fields added to your Google Analytics 4 reports — just add a custom dimension for the existing event parameter! The data doesn’t start collecting until you do this, so do it now! More
Google Analytics 4: Add Session ID And Other Custom Dimensions
Did you know you could report on individual sessions in Google Analytics 4? You just need to add the Session ID dimension to your report. Before you can do that, you need to create the Custom Dimension to capture it — the event parameter already exists! More
Google Analytics 4: Avg Engagement Time Per User
As discussed in the Misunderstood Metrics article, a good measure for success of your web content is ‘user engagement time per user’. That number requires a calculation of the standard metrics User engagement / Total users. Here is how to create that calculated metric in Google Analytics 4 so you can easily include it in your reports. More
Google Analytics 4: Building the Google Analytics Traffic Dashboard
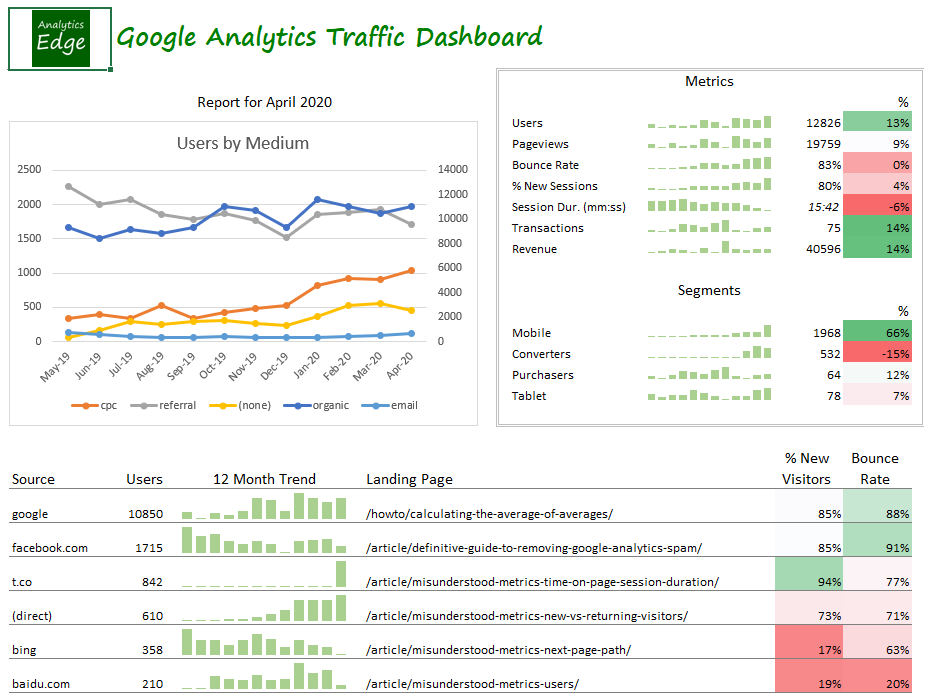 This article describes the steps taken to build the Google Analytics 4 Traffic Dashboard report with the Analytics Edge Add-in for Excel. It follows the approach described in the article Building a Marketing Dashboard in Excel. More
Google Analytics and Search Console data for Power BI
 Power BI can use CSV or Excel files as a data source and Analytics Edge can automate the refresh of those files. This combination provides a few benefits over the typical cloud-based connector solutions like Windsor.ai or Supermetrics: More
Misunderstood Metrics: GA 4 Bounce Rate
What is the bounce rate in Google Analytics 4? Is it better to be higher or lower? What is typical? Does it affect my search engine rankings? Here is some insight into this commonly misunderstood metric. More
Misunderstood Metrics: GA 4 New vs Returning Users
Confused by the new and returning users metrics in Google Analytics 4? Did you know that the “Returning Users” number in the online reports could be wrong? No wonder you were confused…
More
Misunderstood Metrics: GA 4 Sessions
As people dig into the metrics in Google Analytics 4 for website tracking, they discover that the session counts can sometimes be confusing. My recommendation: stop focusing on sessions — focus on user engagement with your content instead.
Analytics Edge makes a no-code automation add-in for Microsoft Excel.
Download data from Google Analytics, pivot, filter, sort, combine, and more
without formulas or finicky AI; just simple wizards with one button refresh.
learn more…
The number of sessions in a day has become almost meaningless, and that metric should not appear in a prominent location in any report. More
Misunderstood Metrics: GA 4 Time on Page / Session Duration
Time on page and session duration are old metrics from the early days of web analytics. You can find the equivalent in Google Analytics 4, but I don’t recommend using them as they are fundamentally flawed as explained below. User engagement is what you should be focusing on in today’s web metrics, so User engagement/Total users is the preferred measure.
Analytics Edge makes a no-code automation add-in for Microsoft Excel.
Download data from Google Analytics, pivot, filter, sort, combine, and more
without formulas or finicky AI; just simple wizards with one button refresh.
learn more…
Add this calculated metric to your property so you can include it in your reports.
Multi-Source Waterfall Report
The wizard-based automation provided by the Analytics Edge Add-in for Excel makes it easy to combine data from multiple sources. This article explores how you can build a Waterfall Report that includes data from Google Webmaster Tools (now Google Search), Bing Webmaster Tools, Google Analytics and an external database. More
Multi-View Google Analytics 4 Queries
The Analytics Edge connector for Google Analytics supports multiple property queries when used in combination with the Analytics Edge Add-in. More
New sign-in from Internet Explorer on Windows
If you just logged into Google Analytics from the Analytics Edge connector, you may get a warning email from Google, confirming the action you just took. More
Reading Google Analytics 4 Detail From Big Query
If you have already setup Big Query linking from Google Analytics 4, here are the steps you need to get that detailed data into Excel via Analytics Edge…simplified. More
Reading Sitemaps to Get a Full Listing of Pages
When analyzing website traffic, there are times you might want a full listing of the website’s pages…even those that never get any traffic or impressions. Google Analytics and Google Search Console will only report on pages were there is data, so these unrecognized pages continue to be overlooked. This article shows how the Analytics Edge Add-in can read the website’s sitemap files to extract a full listing of pages. More
Selecting a Date Range
In most Analytics Edge wizards, you can select a data range for your query. There are a large number of combinations possible, but here are the most common selections. More
Simplified Core Web Vitals Reporting
Google released new guidance on how to collect and report Core Web Vitals using Google Analytics 4, but the approach makes use of some pretty complicated concepts with BigQuery. In this article, I want to show you how to make similar reports in Excel using Analytics Edge with a lot less work and complexity. More
Tips for Google Analytics Reporting
Analytics Edge makes it easy to get data from Google Analytics into Excel, and here are a few tips to make it easier to build impressive reports. More
Year-Over-Year Comparison in One Query
Here’s a neat little technique you can use to get year-over-year comparisons in one query with the Google Analytics Pro connector from Analytics Edge. More
Year-Over-Year Reporting
If you are trying to build a Google Analytics report comparing one year to the previous one, you can use the Pivot operation to make charting easier. The trick is to choose your dimensions wisely. More