 The Search Analytics wizard of the Google Search connector allows you to get a report of the performance of your websites in Google Search.
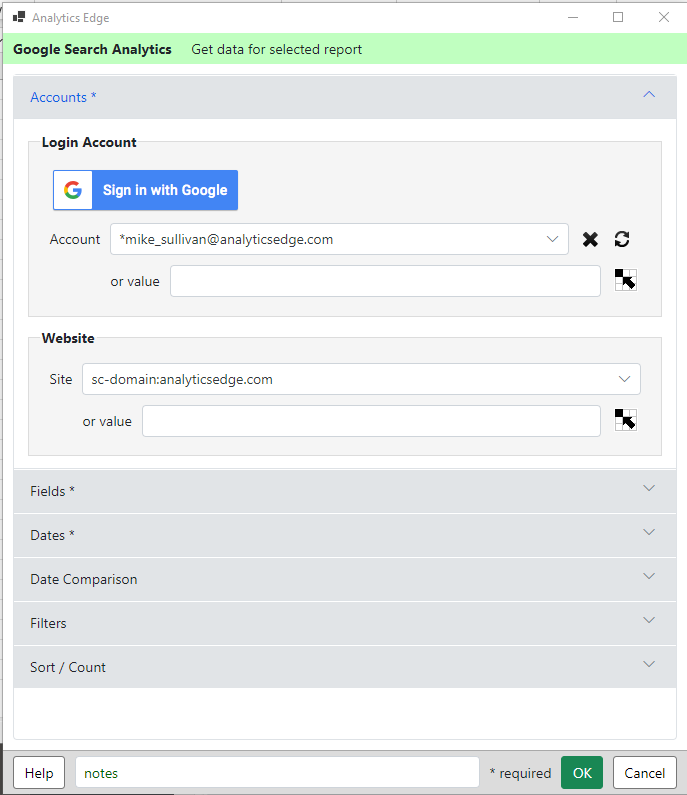
Accounts

Sign in with Google – add a new account to the connector.
Account – select a saved account to use for this query. With the selected account, you can:
- Refresh – update the saved account credentials by logging in again.
- Delete – remove the account from your computer.
- or value – enter an account reference name or a cell reference to it. A cell reference button is included to assist.
Website – select the website or domain for the report
- or value – enter a website or domain reference, or a cell reference to it. A cell reference button is included to assist.
Fields

Split into Multiple Queries by – updated in version 11.34.0/1.34.0, this functionality used to be in a separate section called MultiQuery.
None – Make a single query based on the fields selected. Required for Date Comparison.
Date-based – Make multiple queries in the date range selected on the Dates tab. For example: ‘7-Day Periods’ will make separate queries for each 7-day period. The ‘Week (…)‘ queries will only return complete week periods. Combine this option with a date range of a multiple of 7 days (e.g. duration 12 weeks) to get a report by week.
Note: The ‘Month’ report will get monthly buckets based on your chosen date range. If you want calendar month reporting, make sure to select a start or end date at the beginning or end of a calendar month (e.g. end of Last Month).
Device/Type – Make separate queries for each device or search type available.
Search Appearance – This options runs a query to get all search appearance types for your website, then runs queries for each of them. Note that the results will vary by website and time period used.
Top Pages/Queries/Countries – This option runs a query to obtain the top number of pages/queries/countries for the sorted metrics selected, then runs queries for each of the top entries. While you can enter any number, entering large numbers is not recommended because:
-
- the results must fit into your available memory and worksheet space
- each query counts against your daily limit for all reporting tools you use
- you increase the chances of a random (infrequent) server or network error
Multi-Query cannot be used with Filter Comparison or Date Comparison features.
Layout Options – choose one of three layouts for your results. Updated in version 11.34.0/1.34.0, this functionality used to be in a separate section called MultiQuery.
- Asc / Desc – for date-based options, you can choose asccending or descending date order.
- No Pivot – will append each query vertically, adding dimension columns for the split-by dimension selected (e.g. start date and end date).
- Pivot (group by split dimension) – will append each query horizontally, grouping all the metrics for each query together (by the split dimension). The column titles will include the [dimension] metric combination. e.g. [DESKTOP] clicks, [DESKTOP] impressions, [DESKTOP] ctr, …
- Pivot (group by metric) – will append the queries horizontally, but group similar metrics together. This would make it easier to create trend or comparison charts. e.g. [DESKTOP] clicks, [MOBILE] clicks, [TABLET} clicks, …
Dimensions / Metrics – Click on ‘add dimension’ or ‘add metric’ to select dimensions or metrics for the report. Start typing to filter the list.
Drag-and-drop fields in the lists to change the order, or select fields and the X to remove them.
Dates
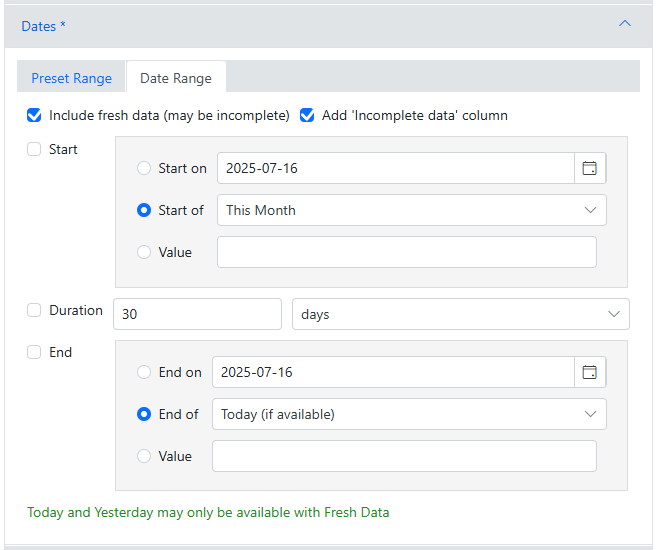
Select a preset range, or select a date range by specifying 2-of the Start, Duration, or End dates.
Start/End Dates can be specified by selecting a specific date, picking a generic ‘Start/End of’ a period, or enter a value or cell reference to a value.
Include Fresh Data – data in Google Search Console doesn’t stabilize for a couple of days. By default, the connector will only pull stable data (upto the ‘Current’ date). Check this box to get the most recent data even if it may change a bit in the next couple of days.
Add ‘Incomplete data’ column – fresh data can include incomplete data that has not been fully processed. Checking this option adds a numeric column with ‘0’ or ‘1’ to indicate whether the data on that row is incomplete (‘1’).
Date Comparison
Compare each metric in the selected date range with the previous period, same day in previous week, previous year, or a specific date range. Optionally add Difference and/or % Change columns.

Date Comparison cannot be used with Multi-Query or Filter Comparison features.
Filters
Filter the report by a variety of criteria.
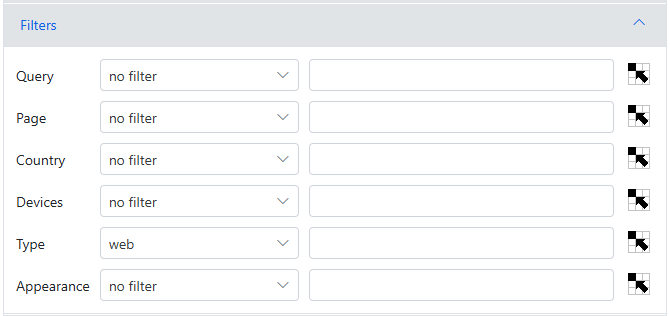
Query/Page/etc – select the values for the filter, optionally using cell references to get the values.
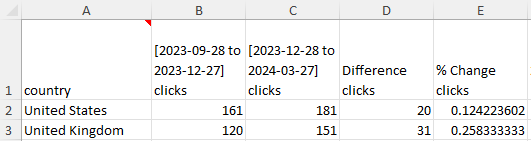
Filter Comparison
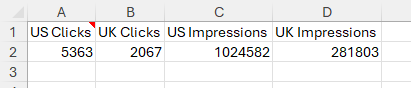
Compare each metric in the selected date range and the base filter with a second filter set. Optionally include a Difference and % Changed column for each metric. For example, comparing US vs UK metrics.
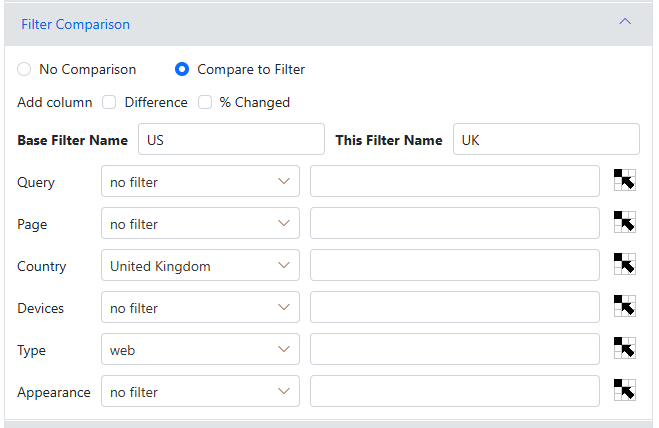
Base Filter Name – enter a name for the main filter selections. The name will appear in the column headings.
This Filter Name – enter a name for this combination of filters. The name will appear in the column headings.
Query/Page/etc – select the values for the filter, optionally using cell references to get the values.
Filter Comparison cannot be used with Multi-Query or Date Comparison features.
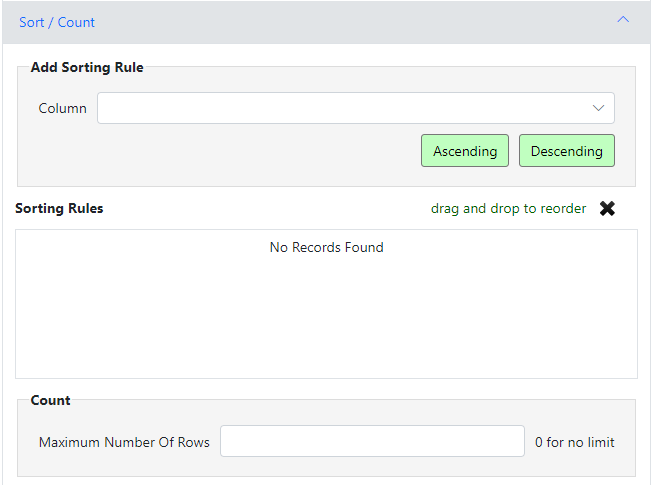
Sort / Count
Add sorting rules by selecting a column and clicking Ascending or Descending.
Entered rules can be rearranged using drag-and-drop, or selected and deleted by clciking the X.
Count – enter the maximum number of rows to retrieve. Leave empty or enter 0 for all rows.
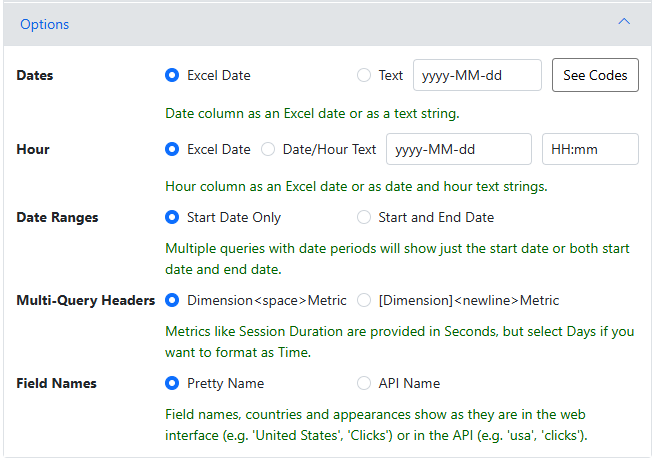
Options
Note that these options change the default behaviour of the function, but old queries will continue to work as before.
Dates – changes whether date column is written as an Excel date or text. If text, you can change the format using date format codes.
Hour – changes whether the hour column is written as an Excel date or 2 text columns (date and hour). If text, you can change the formats for each of the 2 columns.
Date Ranges – when using the Fields option to split into multiple queries with date periods (like 7 Day Periods), this determines whether an End Date column is included.
Multi-Query Headers – when using the Fields option to split into multiple queries, this determines whether the column headers are formatted with the dimension and metric separated by a space, or by a new line character with square brackets around the dimension.
Field Names – choose whether the field names, countries and search appearance values appear as they appear in the web interface (Pretty Name) or as they appear in the API.