How can I help? Email: support@analyticsedge.com
BETA: AnalyticsEdgeTroubleshooter-64bit.exe for 64-bit Excel installations
BETA: AnalyticsEdgeTroubleshooter-32bit.exe for 32-bit Excel installations
The Analytics Edge Add-in for Excel is an add-in for the Windows version of Microsoft Excel that provides spreadsheet report automation tightly intergrated with Excel.

The Analytics Edge Add-in for Excel runs inside Microsoft Excel and lets you automate the data retrieval and analysis, leaving the formatting and charting for Microsoft Excel. Although it is based in Excel, it also provides read and write capabilities with Google Sheets.
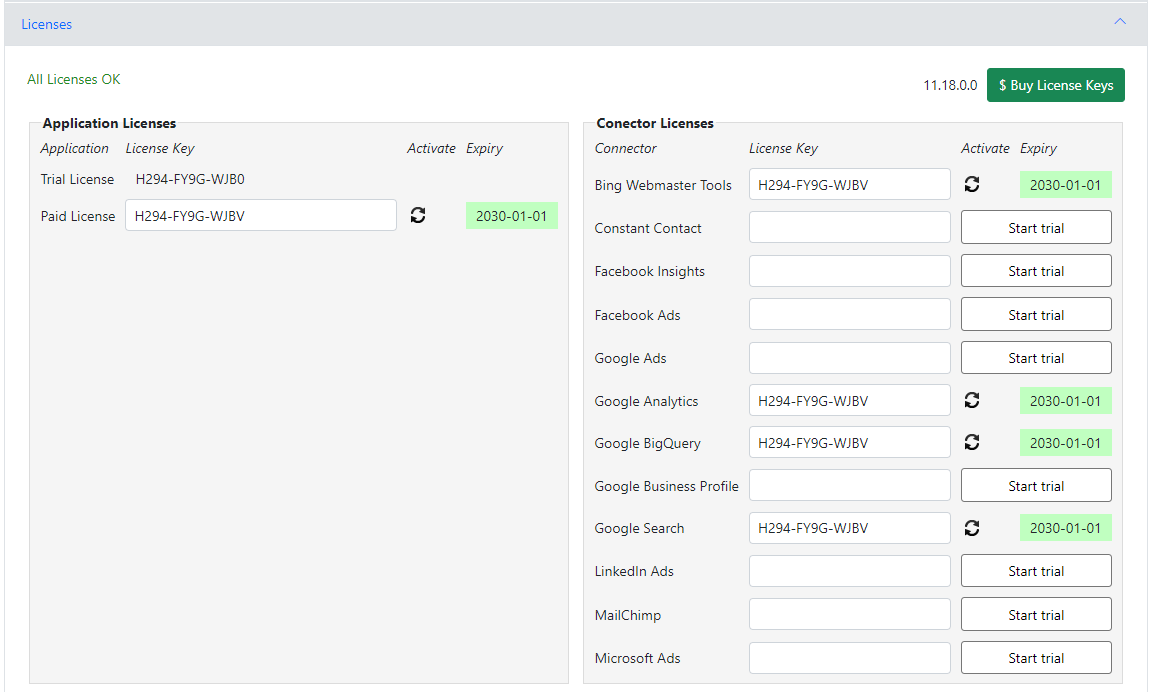
Activation
After installation, the Add-in requires that you open the License wizard to accept the Software License Agreement and Privacy Policy by entering your email address and clicking Accept. The email address will only be used to associate you with the computer licenses for support purposes. Usage tracking is now optional in the latest release — only wizard selection and errors are tracked; account credentials and query details are never tracked.

A trial license will be automatically created for the application, but the connectors are licensed separately. You can activate a trial license for a connector simply by clicking on the respective Start Trial button.
A Special Note About Account Logins
With any login in the Add-in, you may be presented with optional items — ALL of these optional items must be checked for the Add-in to function properly. In all cases, you are authorizing the application installed on your computer, and the resulting security tokens are saved, strongly encrypted, on your computer as well; they are never shared with or accessible by Analytics Edge Inc (the company) or its servers.
