Here’s a neat little technique you can use to get year-over-year comparisons in one query with the Google Analytics Pro connector from Analytics Edge. There are some limitations, but it can make it a lot easier to create quick reports for smaller sites.
Introducing the Month Index
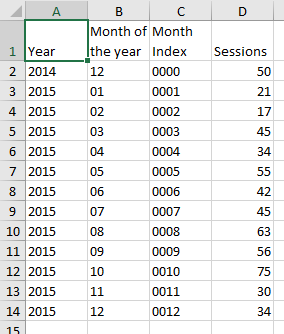 The trick uses a little-known dimension in the API: Month Index. Used with, or instead of, the Month of the Year dimensions, this index always shows the first month in the report as ‘0000’, then ‘0001’, ‘0002’, and so on. Its purpose was to make it easier to build trend charts that span multiple years but didn’t need a timeline on the x-axis, like in sparklines charts.
If you make your query span 13 months, ending at the end of last month, then last month would show as ‘0012’, and the same month in the previous year would be ‘0000’.
Summary: the most recent month is 0012, and the same month a year ago is 0000.
Filtering on Month Index
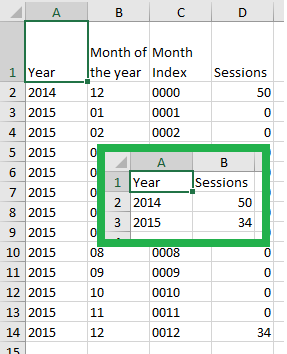 If you add a filter to your query for these two Month Index values (matching regex ‘0000|0012’), then all the other months would show 0.
Note that the Month Index and Month of the Year dimensions are not actually needed in your query. When you remove them, you are left with just the Year and Sessions, and the API drops all the rows where there is no data, so you get only the two months with values!
One query comparing last month’s metrics to the same month last year: query for Year and Sessions filtered for Month Index regex matches 0000|00012.
Add a Dimension: Pivot and Sort
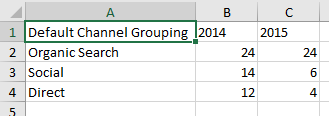 Now we can take this one steps further, and add another dimension, like Default Channel Grouping, to our query and then Pivoting by the Year.
You can get everything ordered properly by sorting the query by Year ascending, then your metric descending. This makes sure that the previous year is shown at the left, and the channel with the larger values are shown first.
Still just one query.
Download an example of this query: year-over-year-in-one-query.xlsx
Volume Limitation
This technique relies on a query that spans 13 months, so if your website has about 40,000 sessions per month or more, the query would involve over 500,000 sessions and Google Analytics sampling would become a concern. If this is the case, I suggest you do it the hard way, with separate queries for greater accuracy.