It may not be obvious, but the Analytics Edge add-ins support the use of Excel Tables (and linked PivotTables). Not sure what an Excel Table is? Chandoo.org has a good introductory article to this powerful Excel feature.
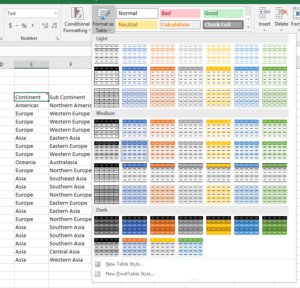 When you add a query to a worksheet, you can easily format the results as an Excel Table. From the Excel ribbon, Home tab, click Format as Table. That’s all you need to do to get started!
Now when you refresh your queries, Analytics Edge will maintain your table formatting, even if there are more rows or columns in the results!
But it gets better…
Support for Calculated Columns
One of the capabilities of Excel Tables is that you can add a new column to the right with a calculation in it, and Excel will maintain that column for you, even if the number of rows changes.
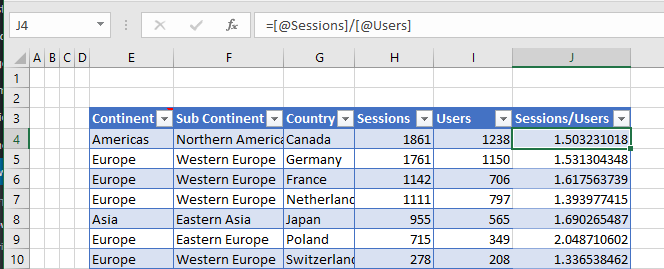
The latest releases of Analytics Edge also support these calculated columns, so you can add your own formulas to the results and let Excel take care of keeping the calculations in sync. For example, if you wanted to calculate the Sessions per User from the Sessions and Users columns, add a new column title and a formula in the first row — Excel will take care of the rest!
Auto-Refresh of PivotTables
There is nothing quite like a PivotTable to better visualize trends, though, and Analytics Edge not only lets you link your tables to a PivotTable, but it also automatically tells Excel to refresh those PivotTables after you refresh your queries.
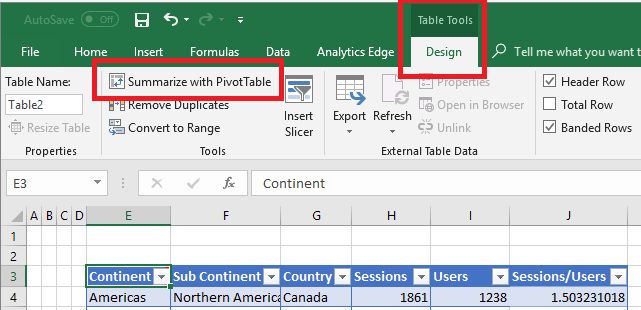
From your Excel Table, select the Summarize with PivotTable button on the Table Tools/Design ribbon. That will open a PivotTable wizard where you can drag-and-drop the various fields into the PivotTable you want.
Now when you Refresh All your Analytics Edge queries, not only do you download the latest metrics, but the results in the Excel Table, calculated column and PivotTable all refresh as well!
Simple Excel report automation!
