The wizard-based automation provided by the Analytics Edge Add-in for Excel makes it easy to combine data from multiple sources. This article explores how you can build a Waterfall Report that includes data from Google Webmaster Tools (now Google Search), Bing Webmaster Tools, Google Analytics and an external database. The same techniques can be used to combine data from any number of sources.
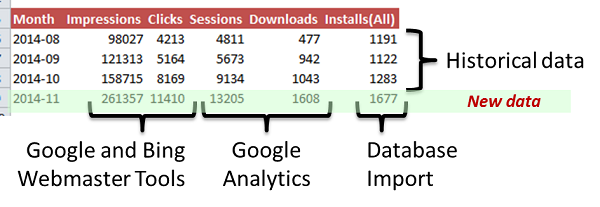
To build the report, I follow the process I outlined in Building a Marketing Dashboard and start by identifying the queries I will need based on the information I want displayed in the report. For the Waterfall chart, I want to start with Impressions and Clicks metrics from both Google and Bing Webmaster Tools (added together). Then I want to show the Sessions and Conversions (Downloads in this case) from the “organic” traffic in Google Analytics. In the last step, I want to include the count of installations from a registration database.
Finally, I want the whole report to retain the historical values, adding the most recent month to the bottom automatically. Since Webmaster Tools only lets you query back 90 days, this will eventually allow me to see year-over-year changes.
Making the individual queries to get the raw data is fairly trivial with the Analytics Edge connectors (for Google Webmaster Tools/Google Search, Bing Webmaster Tools, and Google Analytics), and I can set up a database connection for the registration database or manually import it into a worksheet.
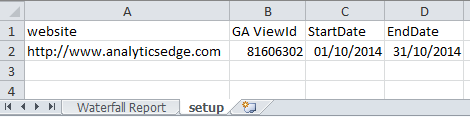
To make the report easier to configure for multiple web properties and date ranges, I create a ‘setup’ worksheet with the critical pieces of data and use worksheet cell references in the query wizards. The dates are optional; the wizards can be programmed to get the last calendar month automatically, but it is nice to be able to set the dates so that previous months can be populated when first running the report.
Without getting into detail, here is the approach I took: I make each query and use Analytics Edge functions to create a “Month” column with the appropriate date. I used the year-month (2014-10) format because it allows the final report worksheet to be alphabetically sorted.
 Google Webmaster Tools
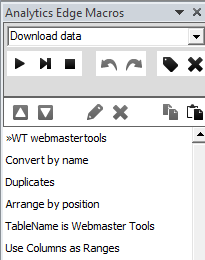
…(now called Google Search) can be queried by date range, but it returns one row per day with individual dates. The Convert function is used to change all the dates to year-month format (making all the rows have the same value), then the Duplicates function totals the metrics into a single row. The ‘Date’ column is renamed to ‘Month’ for the report header, and the result is saved (the table is named) in memory.
One additional step grabs the columns as ranges so the ‘Month’ value is available to the rest of the macro (needed for the next section).
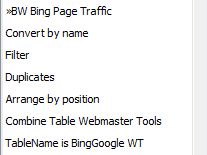 Bing Webmaster Tools
… is queried only by website, and you get a day-by-day listing. To get only the month we want, the Convert function is used to change the date format and then the Filter function keeps only the dates that match the ‘Month’ range value stored in the previous section.
As with the Google data, Duplicates are totalled and the columns renamed/Arranged as desired, then the previously stored table in memory is Combined (summed) to merge Google + Bing data. This intermediate result is saved (the table is named).
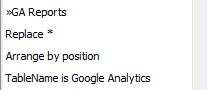 Google Analytics
…is queried (Month of year, Sessions, Goal Completions) and the date column is Replaced with the ‘Month’ range value. Columns are renamed/Arranged and the intermediate table is named.
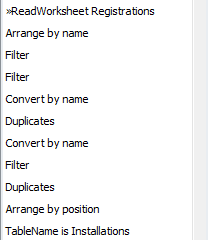 External Registration Data
… is read from a worksheet where it was imported. A number of Analytics Edge functions are used to filter, convert, count and rearrange the information to what we need, then the intermediate table is named.
The steps needed depend on the source data, and Analytics Edge has a lot of powerful functions to transform what you have into what you need.
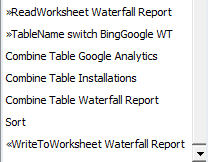 Combining the Results
…is started by reading the historical data from the Waterfall Report worksheet into a named table (the wizard lets you do this in one step).
The new month’s data is combined from each of the named tables into a single row using the month as a key column. Then historical data is combined and sorted before being written back out to the worksheet.
Presentation
 The final presentation of your waterfall data is entirely up to you. Don’t overlook the need to highlight the data that should be looked at — Analytics Edge will save you a lot of time building your report, so use that time effectively. It doesn’t take much to change a line color, bold a number, or add an observation.
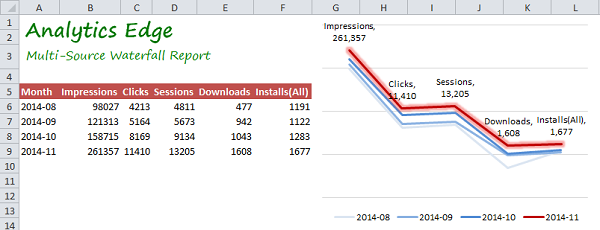
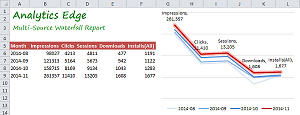
In my example, I added a chart to help visualize the data. Since the number of impressions usually far exceeds the final number of installs, I used a logarithmic scale on the chart. I also removed the axes labels and made the plot gridlines light grey. To make the current month stand out, I used a bright red (and a glow) for that line, and made the previous month lines successively lighter in color. Since I removed the axes, I added in data point labels for the current month. Since the table of numbers is right beside the chart, there is no need to include those numbers as well. A proper report should include a commentary (insights, actions and business impact) section as well.