I f your monthly report is regularly pulling down a full year’s worth of data, it is probably downloading 11 months of data that hasn’t changed. You can speed things up by doing an incremental update — just download the data you need.
Using the Analytics Edge Add-in, it is easy to make the query and drop the results into Excel, but it can do a lot more — you just have to think-through your problem to a solution. The technique described in this article can also be applied to daily data downloads, and with a little extra work, weekly downloads.
Determining the date range needed
The first thing you need to do is to figure out what data you already have, so you know where the new query needs to start. I should note here that I like to update the last month (or day or week) on record, just in case the analytics system ‘settled’ a bit after the last report was run. Google Analytics and Google Search Console, for example, are both prone to change slightly during the first 24 hours that the data is available, and many people are in a rush to get their reports as soon as possible.
We start by reading the data from your worksheet (Read Worksheet function). If there are lots of extra columns in our source data, we can use the Arrange function to keep only the date column. We also only need the last (most recent) row, so we use the Top/Bottom function for that:
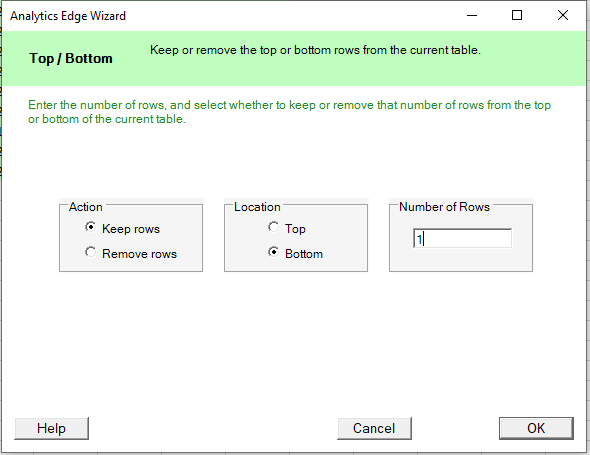
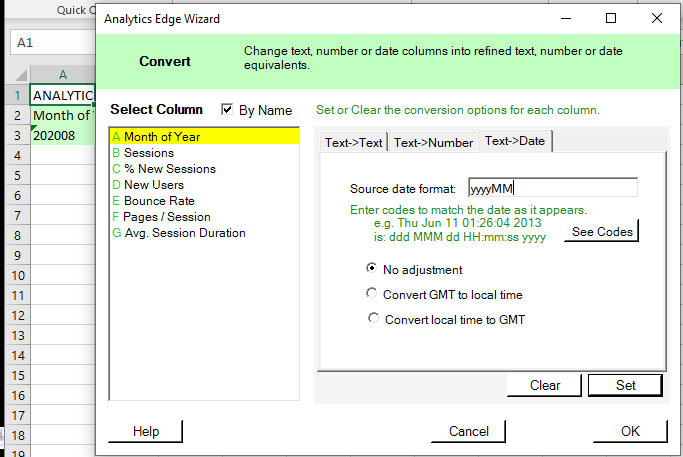
In this specific example, the month is stored as a text value, so we use the Convert function to convert it to a date we can use:
Now we have the data of that last-reported period, we use a Write to Worksheet function to put it into a temporary location (I use a setup worksheet for things like this).

Build the query
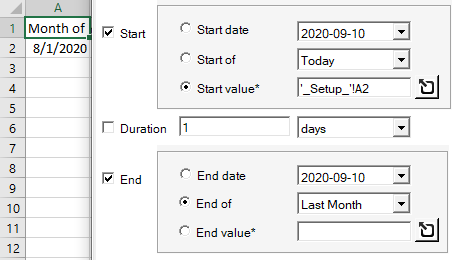
Now it is a simple process to use that worksheet cell to make the query — just use a cell reference for the start date, and end the query at the end of the last period. Note that this could get multiple months (or days if you are reporting by day) if your report has not been updated for a while. This makes the technique forgiving and self-correcting. If you miss a period because the report didn’t run (vacation / holiday / computer failure), it will automatically fill-in any gaps.
Append the results
Now we need to append the data to the current data in the workbook, but there might be a wrinkle: if your report assumes there are only 12 months of data, you can’t just add a 13th and expect it to display properly.
 If you want to ‘keep all history’, then simply use the Append to Worksheet function to add the new rows to the bottom of the existing data. Just make sure to select the ‘Update to new values option’ for matching rows since you will be replacing the first period’s numbers.
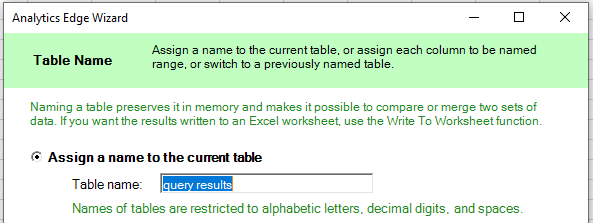
However, typical reports usually cover a fixed period, like the past 12 months. In this case, we need to keep only the most recent 12 rows. Start by saving the new query results to a named table in memory using Table Name function:
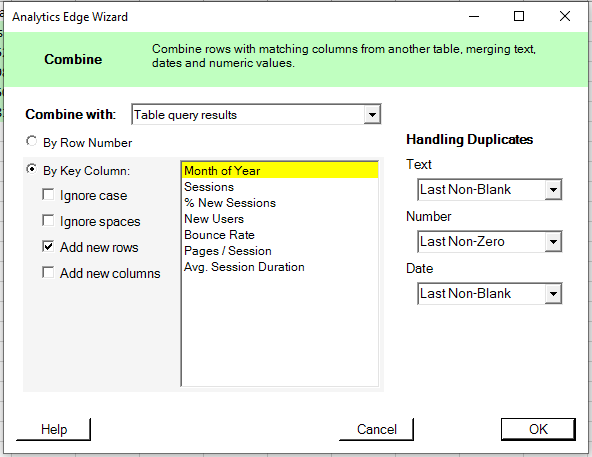
Then re-read the current data from the worksheet and use Combine to merge the new data to the existing. Note that duplicate handling keeps the ‘last’ values — those would be the new query results for that one overlapping month. Since we are combining the new to the old, keeping the last value would keep the new. Also, ‘Add new rows’ is selected so the new data is appended.
And finally, use the Top/Bottom function to keep the last 12 rows, and write it back to the worksheet, overwriting the original data. Done! You can test it out by deleting a few rows and running the macro.

To get things started, populate the date column with a very old date. The macro will take it from there. Sample workbook with macro attached:
incremental-update.xlsx