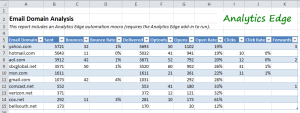
 Find out how your email campaigns are performing with particular domains, so you can see which ISPs your subscribers use most often, and detect if you’re having delivery or compatibility problems. If your messages to one domain are significantly different from others, it may indicate a problem with spam filtering or how your messages appear in the recipients mailbox. Check the Bounce Rate, Open Rate and Click Rate.
Download the workbook: EmailDomainAnalysis-1-41.xlsx
If a domain analysis is not provided by your email service provider, or if you are sending the messages with your own tools, you can perform your own analysis. The process goes something like this:
- Assemble the lists of email addresses that were:
- sent,
- bounced,
- opened,
- clicked,
- forwarded, and
- unsubscribed
- Remove duplicates from each list
- this prevents double counting from multiple opens or clicks by a single subscriber
- Split the email addresses to get the domains
- Get a count by domain in each list
- Merge the counts together into a table
- Calculate the number delivered and the various rate metrics
This is a lot of steps and could be very daunting to tackle using Excel formulas and features, but Analytics Edge makes is much easier. Using the simple wizard interface, you would:
- Read a Worksheet of email addresses (say, those sent to)
- Remove Duplicates to get rid of doubles
- Use the remove Duplicates function again to create a Count column of 1’s beside each address
- Use Arrange to rename the Count column to ‘Sent’
- Name the Table to hold it in memory
- Repeat for bounces, opens, etc. renaming the Count column appropriately
- Append all the named tables together
- [optional: you could save this to a worksheet for detailed analysis]
- Split the address column on the ‘@’ symbol
- Combine Duplicates of the domain portion of the email addresses, summing the counts
- Calculate the Delivered count (sent-bounced)
- Calculate the Bounce Rate (bounced/sent)
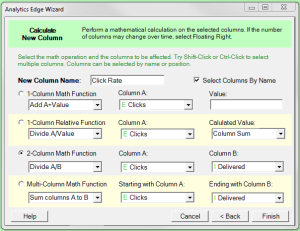
- Calculate the Open and Click Rates (opens/delivered, clicked/delivered)
- Arrange the columns as you want them
- Sort the results by the number sent to see the most popular domains at the top
- Use Write to a Worksheet to create an Excel table with AutoFilter enabled
 Each step is a simple wizard function, selecting columns and options to perform each operation. The results appear in a temporary worksheet so you can confirm that you have it right, and you continue to add each step, building towards your desired result.
If you make a mistake, you simply select the function in the list and click the edit icon (it looks like a pencil) to open the wizard and make any changes you need.
Analytics Edge lets you build your solution one step at a time without requiring confusing formulas. And when you are done, it is all recorded so you can refresh the whole report with just a click.
This type of domain analysis can be performed easily, and the techniques used can be applied to other lists you may have. Check your delivery on a regular basis, especially if you see new features being introduced like the new Gmail tabs.