 This article explains what is possible using the Analytics Edge macro capabilities. It pulls in Google Search data for your website pages and produces a report showing the totals and top queries for your popular pages.
Getting The Data
The report uses the results of 2 Google Search connector queries; starting with the page data,

and one (to be loaded later) with the page/query details.

In order to combine the page data with the detail data later in the macro, a ‘query’ column is inserted into the table, containing the text ‘** TOTAL **’. The Append function allows you to insert this column, pre-populated with the text.

Then the macro saves this table in memory by assigning it a Table Name, and continues by getting the page/query data from the Google Search connector.
Appended Data
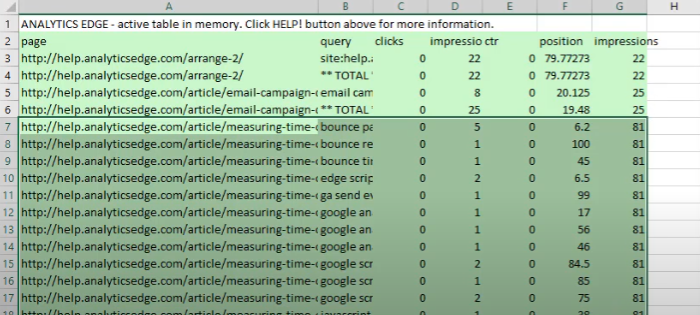
Appending the previously saved page data, and sorting by page, we can see the combined data includes the page totals along with the details for each query on that page.

Add Total Page Impressions
In the report, we want to see a column showing how the number of impressions for any specific page/query combinations compares to the total for that specific page — the ‘% page impressions’. To do that, we use the Lookup function to get the total impressions from the saved table. Then it is a simple calculation to get the percentage.

Filter And Sort As Desired
With all those columns, you can now filter out pages with low impression counts, and eliminate any queries which have low % page impressions numbers. What you are left with is a more concise report of the highlights. [The second impressions column is removed to avoid confusion]

Leveraging Excel Conditional Formatting
The video then describes how to use Excel’s conditional formatting to highlight the ** TOTAL ** rows to make the report more readable. See the video for details.
