Long-tail keyword phrases are often made up of many different combinations of similar words, making it difficult to tell when there is a common topic of interest. This article walks through the creation of a keyword analysis report, based on weekly snippets of data from Google Search Console. It goes beyond most keyword reports by splitting the search phrases into individual words, applying a Soundex function to group similar and misspelled words, and merging the results into a historical trend analysis. The result shows which individual words are rising or dropping in interest over time.

This is an advanced example of the capabilities of the Analytics Edge add-in along with the Connector for Google Search. The workbook uses several special techniques to deliver the analysis, and the magic happens with the click of a refresh button:
- using a Setup worksheet to configure the macro functions
- using Regular Expression search and replace to remove non-letters
- splits multiple-word phrases into multiple rows
- uses a custom SOUNDEX function written in VBA
- merges the results with the existing historical worksheet
1. Using a Setup Worksheet
 We start by creating a worksheet to contain values that will customize our analysis. In this case, we want to be able to set a start date (Webmaster Tools data has a 2 day lag), identify the website to be reported on, and establish a threshold level below which we will ignore query terms (don’t set this too high, or you will lose many of your long-tail keyword phrases).
 Each value is put into a little table with a header row containing labels we will use in the macro. The Analytics Edge ReadWorksheet function is used to get the values, and they are assigned to range names by checking the wizard’s option.
Notice that we are reading a specific range of cells; our setup data could be on a dashboard worksheet. You don’t need to dedicate a whole worksheet for just a few cells.
Assigning range names to the columns lets us reference the range in other macro functions, creating an analysis that is determined by worksheet settings. In this case, the Google Search query wizard uses the site value [Website], and the end date [Date]. The [Filter] value is used in the same way in the Filter wizard.

Analytics Edge lets you automatically tailor your analytics using data from your worksheets, so you can really integrate the analysis into your environment. Note that you could even use data from other workbooks; there are so many possibilities!
2. Using Regular Expressions in Search and Replace
 For the ultimate in flexibility, the Analytics Edge Replace wizard supports advanced RegEx search/replace capability. This example uses it to remove all of the non-letter characters in the search terms.
Regular Expressions are an advanced topic, so if you need guidance on how they work, check out a few of the many online resources available.
There are a few types of regular expression ‘engines’, each with subtle differences in syntax. Analytics Edge uses the Microsoft .NET version. You can use $1, $2, $3, etc. to insert the text matched between capturing parentheses into the replacement text. In this example, we keep the letters and replace the non-letter characters with spaces.
Being able to use regular expressions means we can handle almost any search-and-replace challenge. The simple wizard interface doesn’t limit you to simple functions!
3. Split Phrases Into Multiple Rows
 A new feature in the Analytics Edge Split wizard lets you split a column with multiple values into multiple rows with a single value in each row. All other column values are copied to the new rows.
This gives us a row for each word in the original phrase. By using the Duplicates wizard, we can then see how many times a word appeared in any phrase, and get the total number of impressions and clicks for all of those phrases combined.
With long-tail keywords, it is very common to see variants of the same query (e.g. ‘bing webmaster tools’, ‘bing webmaster’, ‘webmaster tools bing’), with one or two words different. This will let us see how often each individual word appears in a search term, giving us a better idea about what topics are of interest.
This is another example of Analytics Edge putting a simple interface on an extremely powerful function — well beyond what you could do in native Excel, and without programming!
4. Use a Custom VBA Function
Once we have the words split out, it becomes obvious that people can use a lot of word variations in their queries (automation, automate, automated, automating). Most applications would take each word literally and treat them as different words, splitting the number of impressions and clicks so we get 4 small numbers instead of one big total.
There are a variety of ways to group similar words, and for this example I chose to use a custom Soundex function I found. The function is added to the workbook as a VBA function, and can be used by creating a formula of the format =Soundex(“word”). It returns a coded representation of similar sounding words. Two words with the same Soundex value should sound alike, and are often variants of the same word.
 The Analytics Edge Formula wizard allows you to add a column with a custom function — any Excel function. In this case, we add a column that calculates the Soundex of column A, which contains our query words.
Writing this to a worksheet forces Excel to evaluate the formulas and determine the values in the column.
If we then read the values back into the macro by reading the worksheet, we make it possible to ‘push’ a unique calculation into Excel, bring it back in, and then continue with our analysis in Analytics Edge.
Using the Formula wizard in this way lets us leverage the many specialty functions that already exist in Excel (Statistical, Financial, Engineering), and as in this example, even functions from other extensions and VBA code. Analytics Edge extends and automates the capabilities of Excel.
5. Merge Results Into an Existing Report
Like many reports, it helps to have some context around the current status, and that usually comes from comparing it to the last reported values. Many reporting tools would have you duplicating the queries to generate the previous period values, and they do this to make the report autonomous and self-regenerating. But this approach doesn’t work for data sources that have a limited history available, like Google Search Console’s 90-day limit, or if the analysis is process intensive.
 As we have already seen, Analytics Edge can easily read existing worksheet values. It also has 5 powerful multiple-table wizards that can Append, Combine, Compare, Match or Update data from the existing report with the new query.
In this example, we arrange the results of our query to become the first few columns of our report. To keep the impressions column intact and in perspective, we relabel it using the [Date] range value we started with. This gives us a dated column.
 Then we simply Update the analysis with the contents of the old report worksheet, using the Soundex value as the key. The Update function automatically aligns the rows and columns, replacing (updating) values that match with values from our worksheet.
In this case, we select to Replace only empty cells, meaning the most recent data will not be overwritten. Our new analysis results will remain untouched.
We also choose to Ignore update if empty, meaning that if the matching row/column in our analysis does not exist in the worksheet (i.e. it is ’empty’), do not delete our new data.
The last two options to Add new columns from update and Add new rows from update will bring all the historical dated columns from the worksheet into the report, as well as any words that appeared in the previous report that have disappeared in the most recent analysis.
A huge amount of flexibility and power from four little check boxes. The result is written back out to our report worksheet, and it shows the first 5 columns from our new analysis plus all of the historical data from the previous report.
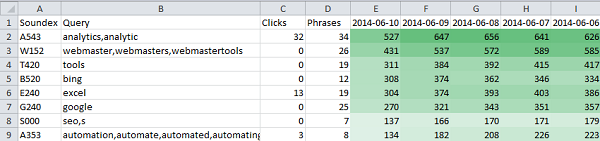
Now you can see which words are more common in queries leading to your site, and see how that changes over time. Use a little Excel conditional formatting and trends can easily be seen.
Using the Report
Even in the first report, you can see the individual words that, in some combination, tend to bring people to your site. If the Soundex function combined data for several word variants, they are all listed in the Query column. Over time you can see individual words become more or less common, which may reflect new content, changes to your site, changes in ranking algorithms, or a shift in topic interest.
Flip over to the Query Results worksheet to see the raw query terms most recently used and all the metrics around them. This information is included because summarized or processed data almost always raises questions, and it is important to be able to see where the numbers came from…to drill down into the source.
Summary
The techniques used here demonstrate some of the advanced analysis capabilities of Analytics Edge. The analysis is recorded automatically and can be refreshed with a simple click. Information can be pulled form a worksheet to customize the analysis, and powerful transformations like regular expressions and splitting columns into multiple rows are easily to include. If you need a special function or calculation, Analytics Edge can work with all of Excel’s capabilities to deliver the numbers you need. Finally, it is a simple matter to retain historical report information as part of your refresh, so you can easily keep track of how this change over time.
Analytics Edge does all this and more!