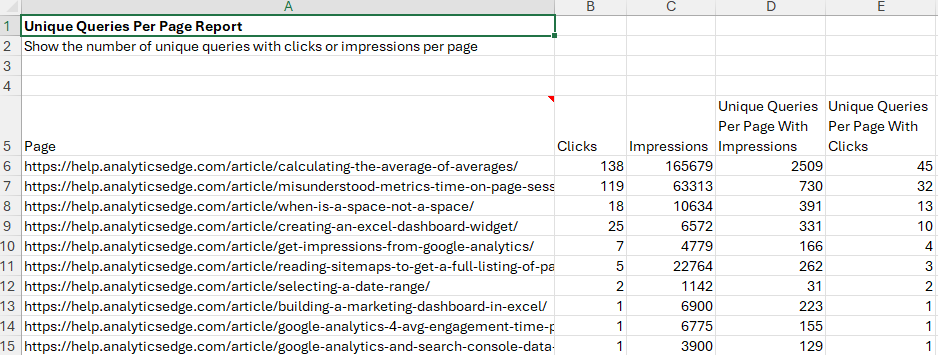
 This Analytics Edge report shows how many unique queries were associated with your page in Google Search. It also shows how many actually led to clicks.
This gives you a quick sanity check on whether a page is heavily reliant on a low number of focussed queries or more broadly available to long-tail searches.
Creating the report with Analytics Edge
The Macro
 Starting with a Search Analytics query that pulls the page, query, clicks and impressions this produces rows for each page-query combination. Since we don’t need the query column — we need the rows but not the actual queries themselves — Arrange is used to remove it. TableName saves this table for reference later.
To get the number of queries with clicks, we Filter to remove zero-click rows. Duplicates is then used to get a count of the queries (rows) for each page, and Arrange renames that column ‘Unique Queries Per Page With Clicks’. TableName saves this result for reference later.
TableName then switches back to the unfiltered Search Analytics results previously saved. Duplicates and Arrange are used again to get the count column ‘Unique Queries Per Page With Impressions’.
Lookup pulls in the ‘Unique Queries Per Page With Clicks’ column for matching pages. Finally, Sort reorders the table and WriteToWorksheet writes the result to the sheet.

Filter clicks > 0

Duplicates adds a count of rows

Arrange renames the count column
This is another quick Analytics Edge report that will broaden your understanding of how your site performs in search.
Analytics Edge makes it easy to surface new insights.