 How do the number of pages appearing in search change over time? What about just the number of pages with clicks? This Analytics Edge report shows it all.
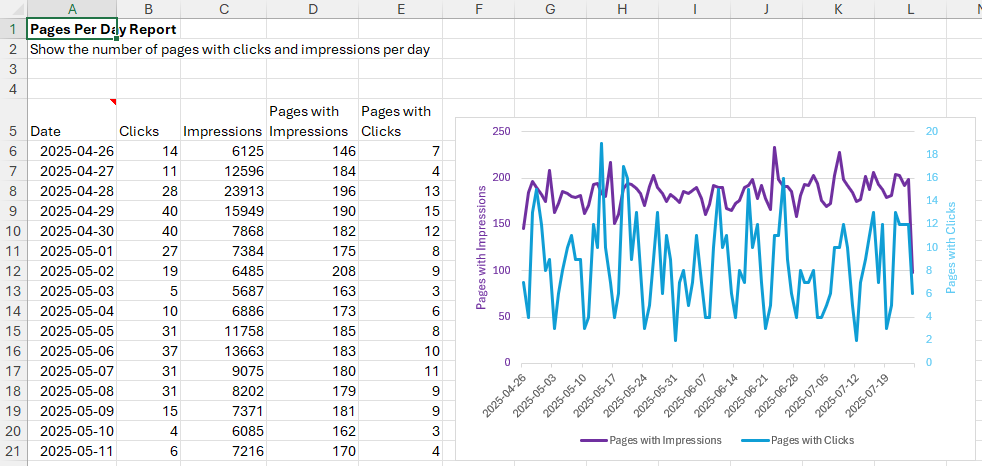
See how the number of pages with impressions and clicks changes after a site change or search algorithm update.
Creating the report with Analytics Edge
The Macro
 The process starts with a Google Search Analytics query, pulling date, page, clicks and impressions. This produces one row per date per page, but we don’t actually need the page, so an Arrange function removes that column. This table is saved using TableName for reference later.
To get the number of pages with clicks, we Filter out the rows with zero clicks (image). Then Duplicates is used to get the count of pages (image) and Arrange renames that column ‘Pages with Clicks’ (image). TableName saves that table for reference.
To get the number of pages with impressions, we switch back to the first saved table with the unfiltered query results, then repeat the process above: Duplicates gets the count of pages and Arrange renames it ‘Pages with Impressions’.
A Lookup function gets the pages with clicks from the second saved table, and the result is sorted by date before WriteToWorksheet writes it into the sheet.

Filter clicks >= 1

Duplicates to get count of pages

Arrange renames the count column
This quick little report gives you a site-wide view of the impact of changes on your search performance with metrics you can’t get from Search Console.
Analytics Edge makes it easy in minutes without formulas or coding.