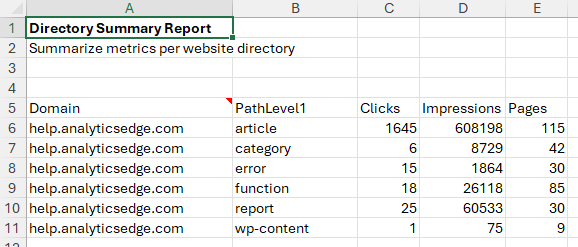
 This Analytics Edge report quickly summarizes the Google Search Analytics performance of your website by the primary subdirectory.
It also shows the number of pages that appeared in search over the reporting period.
Creating the report with Analytics Edge
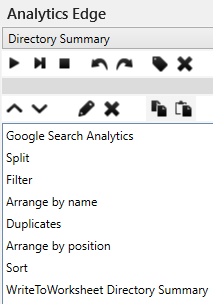
The Macro
 The analysis starts with a Search Analytics query pulling the page, clicks and impressions. A Split function is used to split the page into its component parts like protocol, domain, and pagepath (image). This includes parts of the URL path including PathLevel1 (first subdirectory) and PathLevel2 (second subdirectory) .
To get the top-level folders, Filter is used to remove rows with top-level pages — those without a PathLevel2 value (image).
The results are Arranged and Duplicates is used to get the sum of the clicks and impressions as well as a count of the pages.
Arrange and Sort complete the preparation and the final results are written to the worksheet.
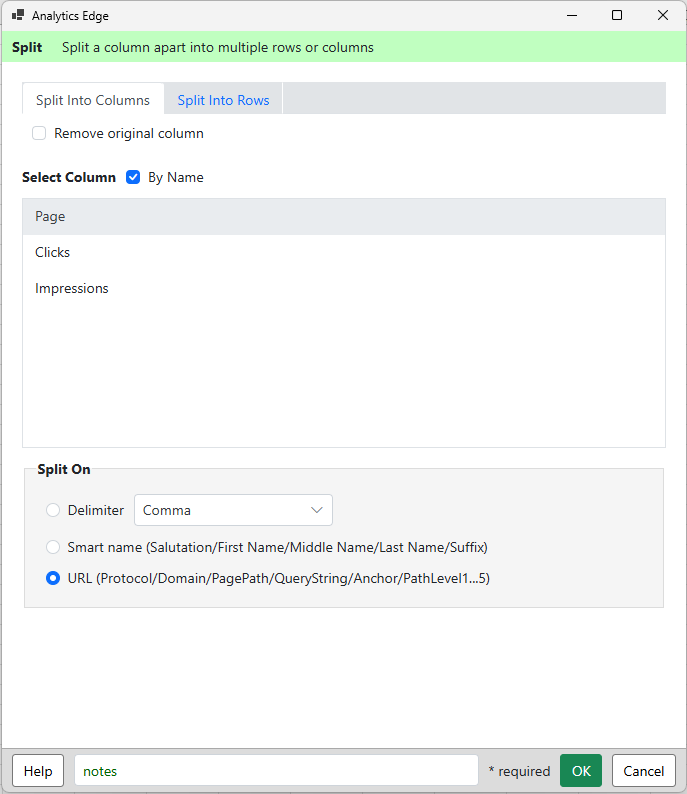
Split into URL components
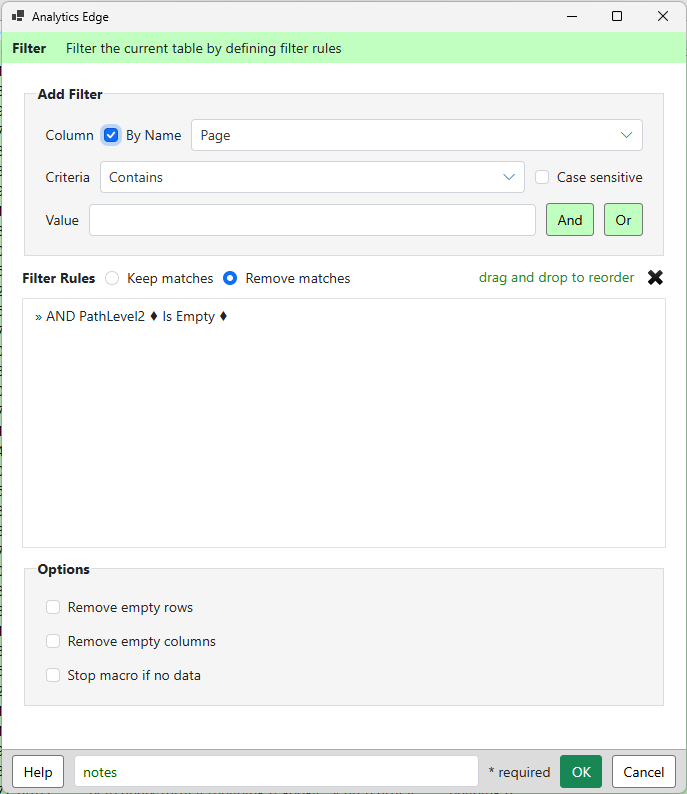
Filter out top level pages
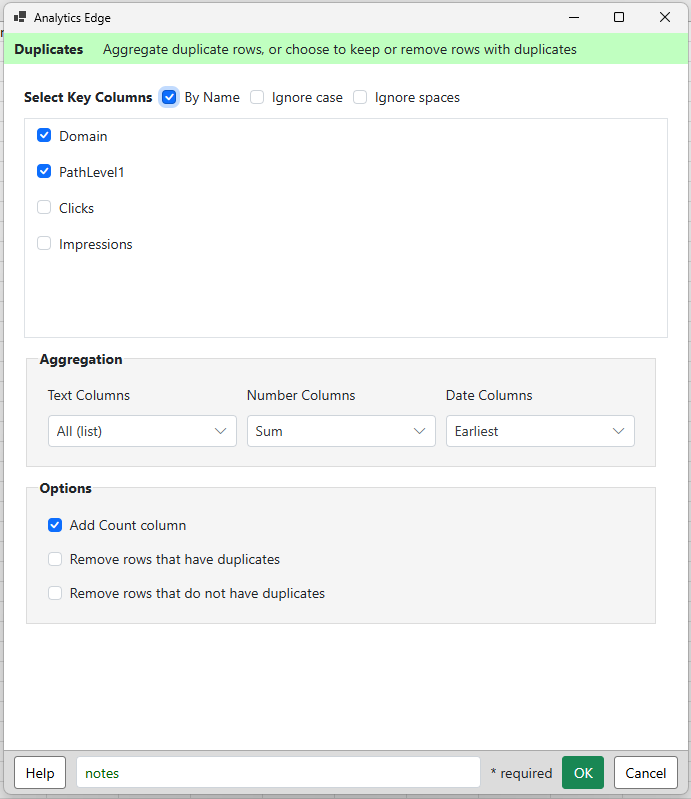
Duplicates gets totals and count of pages
This quick report can easily be modified to summarize at different subdirectory levels for more structured websites.
Analytics Edge is designed to make the work quick and easy.