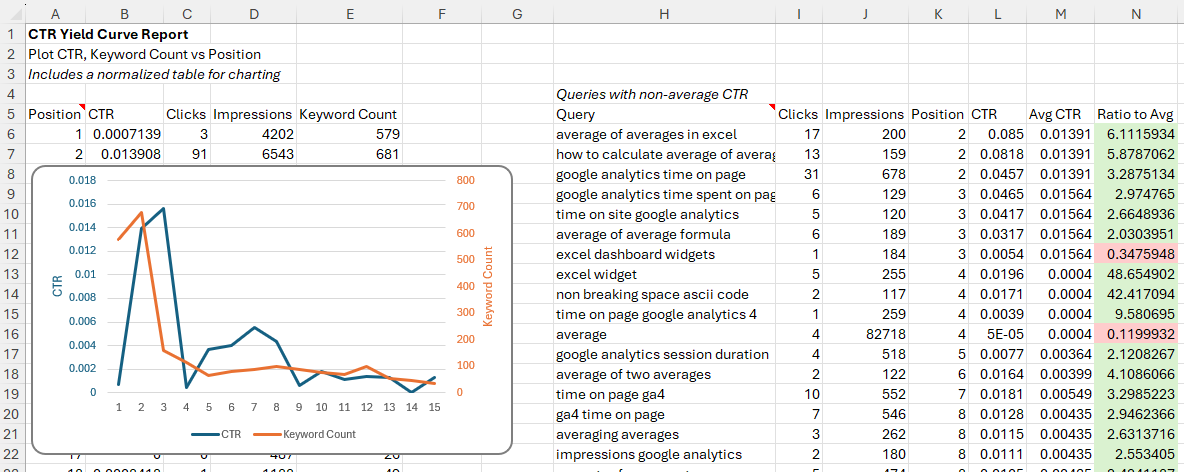
 Plotting click-through-date against position lets you confirm the effect of position on your content’s performance in search. This Analytics Edge report shows you both how CTR changes with position, but also how the keyword count varies as well.
It also shows a selection of keywords that have non-average CTRs for the position they are in.
Creating the report with Analytics Edge
The Macro
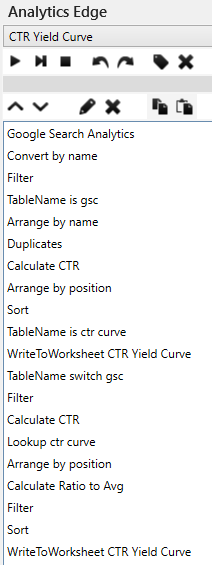 Starting with the Google Search Analytics query, the Convert function is used to change the position numbers into whole numbers, then the results are filtered for the top positions only (image).
This table is saved for reference later, then the query column is dropped with an Arrange function, and Duplicates gets the total clicks and impressions for each position (image). CTR is calculated and the results are arranged and sorted before writing to the worksheet (a copy of that table is named for reference later).
Switching back to the main results, they are filtered for impressions >100 and clicks >0. Then the CTR is calculated for each row and a Lookup function gets the average CTR for the position from the other named table (image).
The columns are arranged and the Ratio to Avg column is calculated. The final list is filtered and sorted before writing to Excel.
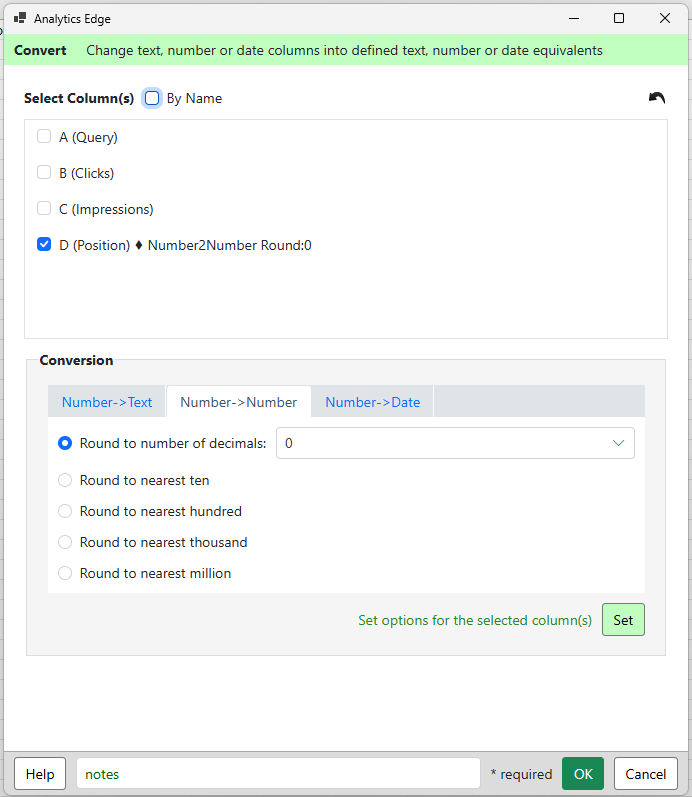
Convert position to whole numbers
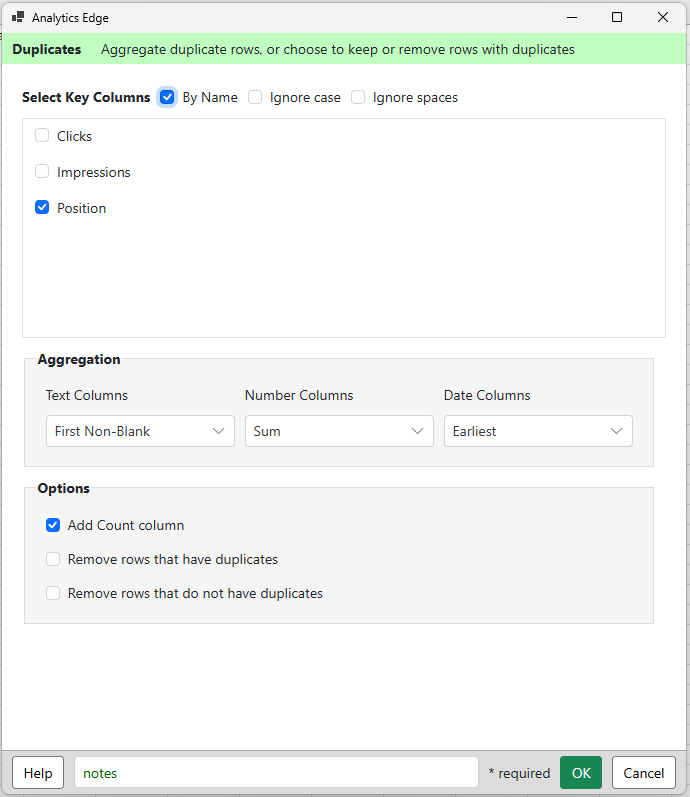
Duplicates to total by position
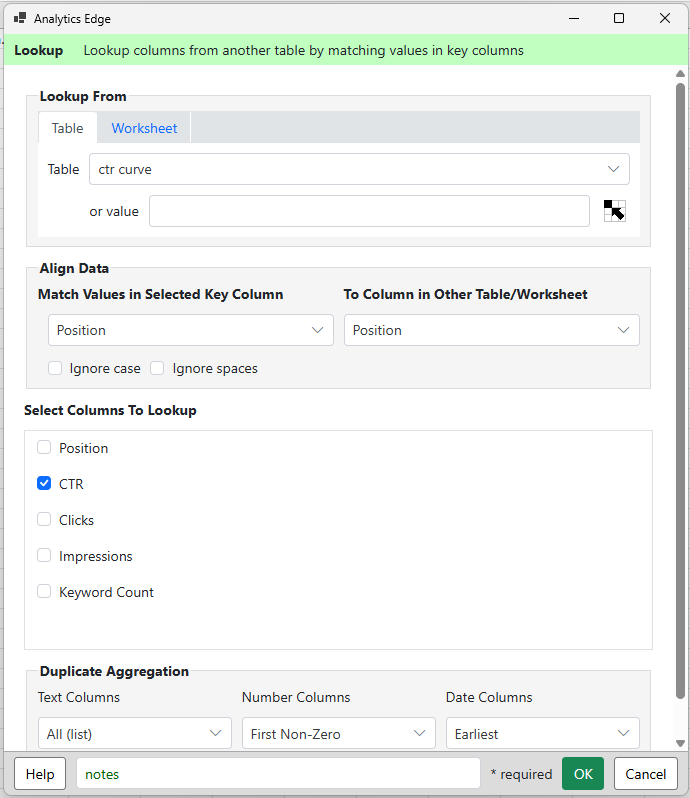
Lookup average CTR
This report shows how easily you can complete your analysis without a lot of effort (and no programming).
Analytics Edge lets you focus on your data, not the tool.