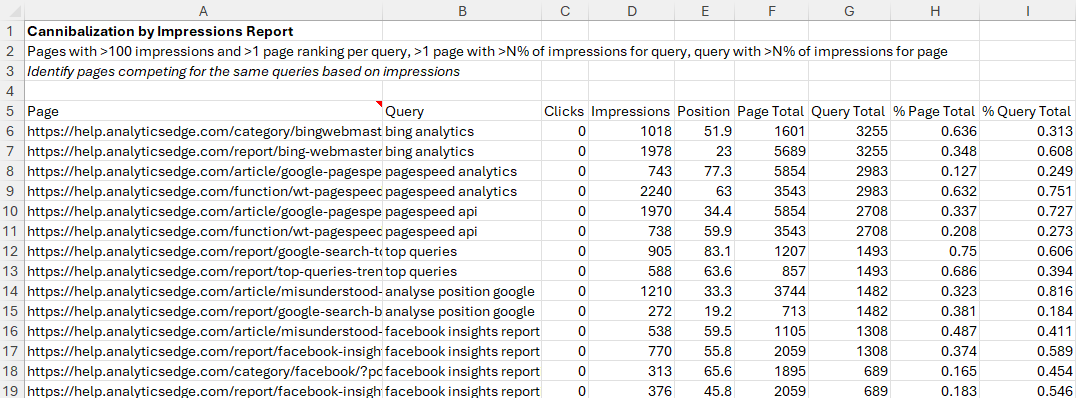
 This report shows pages that are competing for clicks (or impressions) for the same query. When there are multiple pages with similar content appearing for the same query, they can ‘cannibalize’ each other, reducing their effectiveness in search.
This report identifies opportunities to combine or optimize the pages so that one of them becomes predominant. Analyzing by clicks shows which pages may be ‘stealing’ clicks from other pages, while analyzing by impressions may uncover opportunities where pages aren’t getting the positions or clicks they could.
Creating the report with Analytics Edge
The Math Involved
How do we identify pages that compete for the same query? We start by looking for pages with a significant proportion of the clicks/impressions for the same query — a % Query Total. This eliminates the pages that don’t challenge the effectiveness of (‘cannibalize’) the primary page. Higher percentages compete more, so we would set a higher threshold, say 0.1 (10%), to get the worst case offenders.
We also want to make sure that the query is a significant proportion of the clicks/impressions for the page – a % Page Total. Pages that do not have similar intent may appear for the same search, but chances are they would get more traffic for different queries. A higher percentage here would indicate the page has a similar intent and is more likely cannibalizing the primary page.
The Macros
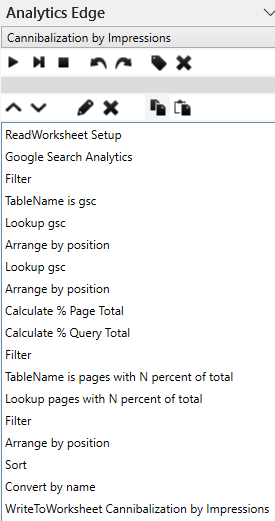 There are 2 macros in the report: Cannibalization [by Clicks] and Cannibalization by Impressions — they are almost identical.
The process starts by getting the threshold value from the Setup worksheet for the filters. In this example, we use the same number for all the filters for convenience. A ReadWorksheet function reads the Setup sheet and saves the value for later use (assign range names to columns).
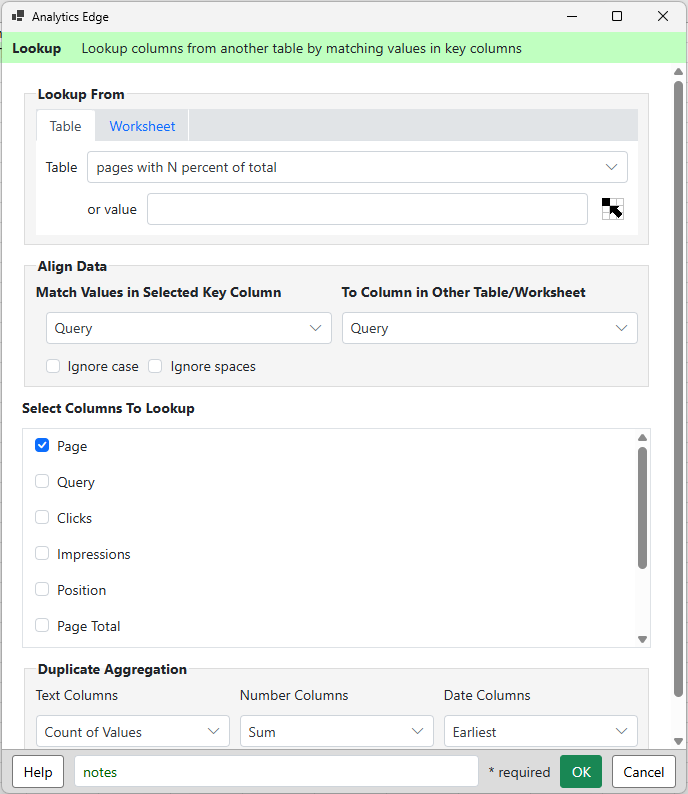
The main Google Search Analytics query is run, and TableName holds that result set so we can reference it. A Lookup function is used to get the sum of clicks (or impressions) for matching pages (image) — lookup in this table and get the sum of the clicks where the Page matches. Arrange is then used to rename that column ‘Page Total’.
Another Lookup function is used to get the sum of clicks (or impressions) for matching queries, and Arrange is used to name that column ‘Query Total’.
Calculate is then used to create % Page Total (image) and % Query Total columns, and the Filter is used to keep only rows with % Query Total and % Page Total greater than our saved threshold. It also removes rows where % Query Total equals 1 which removes queries with only one page. TableName saves this list (‘pages with N percent of total’) for reference.
Lookup gets a count of the Pages in that filtered table with matching Query (image), and Filter gets rid of single page results. Arrange drops that extra count column, and Sort orders the list by Query Total and Query — the list will show queries with the highest total clicks (or impressions) first since those are likely the ones with the biggest opportunities for improvement.
Finally the Convert function changes the Position number to 1 decimal place, and the % Query/Page Total columns to 3 decimal places to simplify the report visually without making you set formatting for the individual cells. WriteToWorksheet writes the results into Excel.
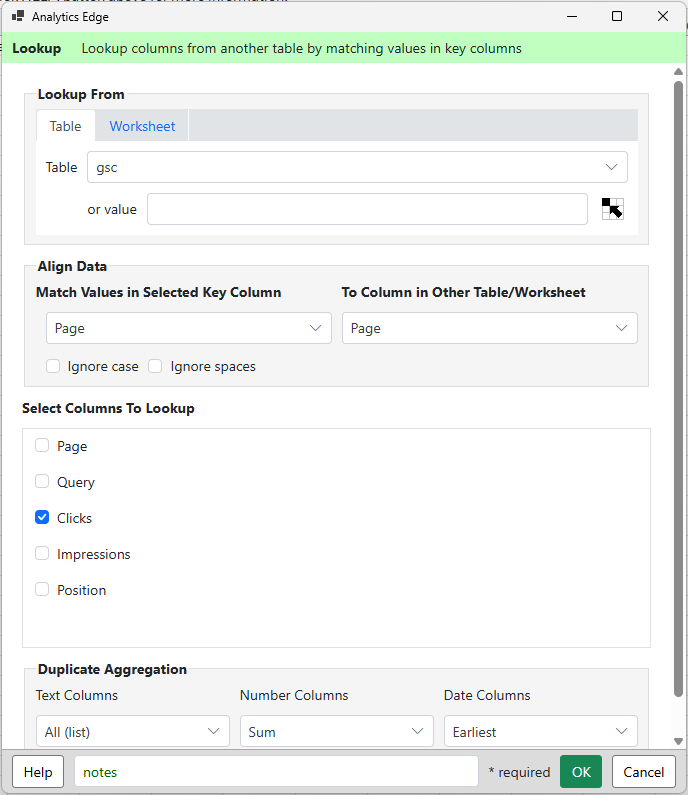
Lookup sum of clicks for page
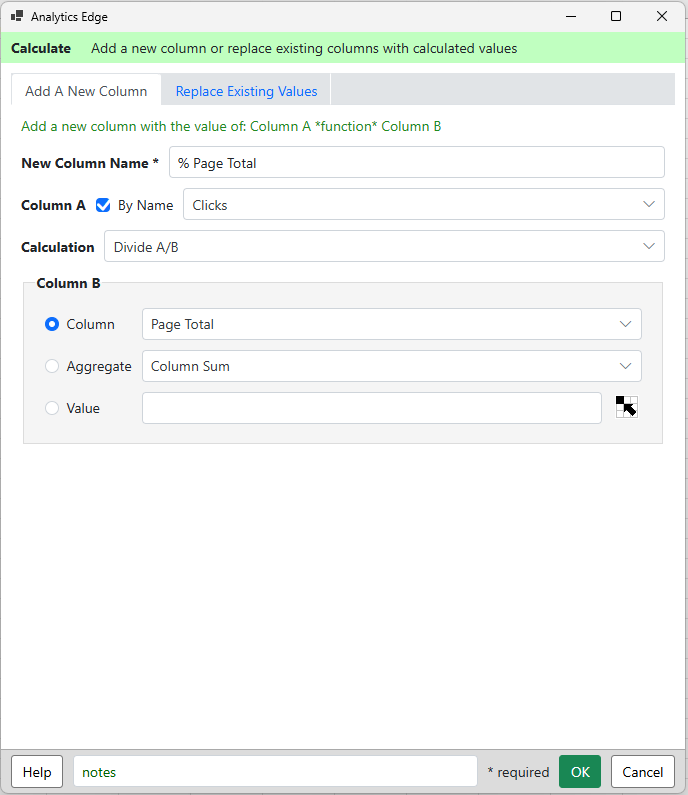
Calcuate % page total
Lookup count of queries by page
This report shows how Analytics Edge macros can quickly perform complicated analysis without complex (and much slower) Excel formulas.
Work faster with Analytics Edge.