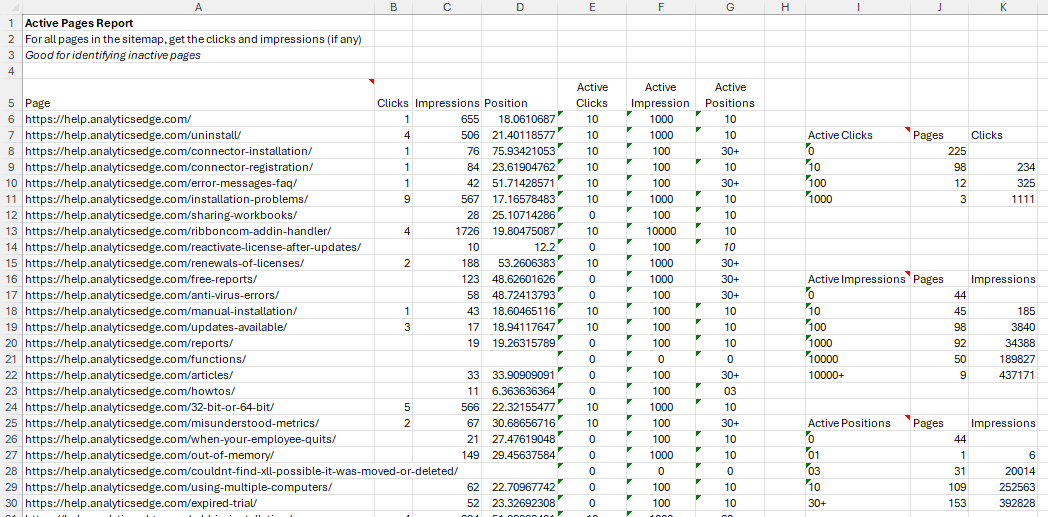
 Google Search Console can only report about pages that appeared in search, but your sitemap contains all the pages on your site. This report combines the two to show which pages are active in search, and those that aren’t. It also summarizes how many pages had zero clicks and zero impressions as well as in various positions.
The report can be used to evaluate how much of your content got very little, if any, search exposure. The summary tables offer a quick peek at the number of pages for various click counts, impression counts, and top position groups.
Creating the report with Analytics Edge
 The Macro Part 1 – Process the sitemaps
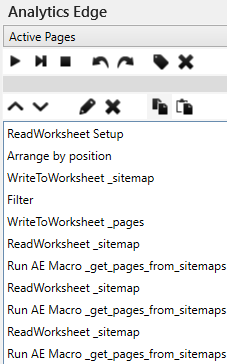
The first part of the Analytics Edge macro processes the sitemaps. Reading sitemaps with Analytics Edge is explained in more detail here.
Multiple sitemap URLs can be entered into the spaces provided in the Setup worksheet. The ReadWorksheet, Arrange, and WriteToWorksheet functions copy this list to the _sitemaps worksheet to be processed. It then filters out the list and writes a blank list to the _pages worksheet, clearing any previous pages left over from previous runs.
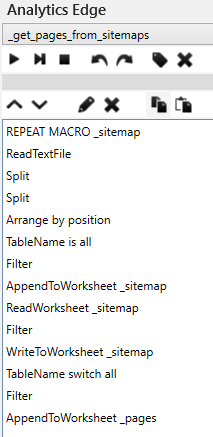
The _sitemap sheet is read, and if there are any XML URLs listed, they are processed by another macro (_get_pages_from_sitemaps) described below (image). This other macro reads each sitemap and splits the results into _sitemaps or _pages depending on what it finds.
That 2-step process is repeated twice more to capture the pages from hierarchical sitemaps 3-levels deep, which should be enough for more sites.
The Macro Part 2 – Process the click data
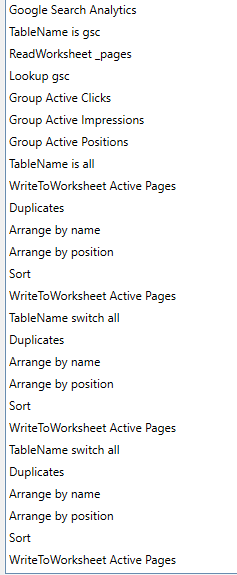 The Active Pages macro then makes a Google Search Analytics query to get the pages appearing in search. TableName is used to hold this data in memory.
ReadWorksheet is used to grab all of the _pages from the sitemap processing. and Lookup is used to get the matching clicks, impressions and position from the saved query results.
Three Group functions add three new columns, grouping the clicks, impressions and positions into summary categories (image). For clicks and impressions, we used decade steps, and for the position we used a 1-3-10-30+ grouping.
The full table is saved using TableName (‘all’) and then written to the Active Pages worksheet.
To create the summary tables, the Duplicates function is used to get a count of pages and sum of the clicks or impressions for each category (image). Arrange and Sort functions clean up format and the summary table is then written to the worksheet.
A TableName function switches back to the ‘all’, and the next summary table is created and written to the worksheet. This process is repeated for the third summary table to finish the report.
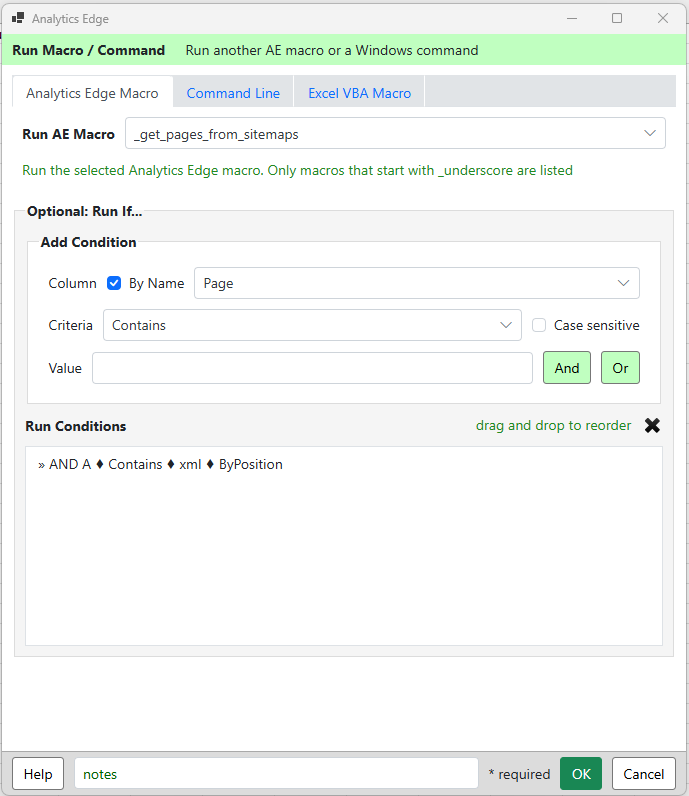
Run macro if…
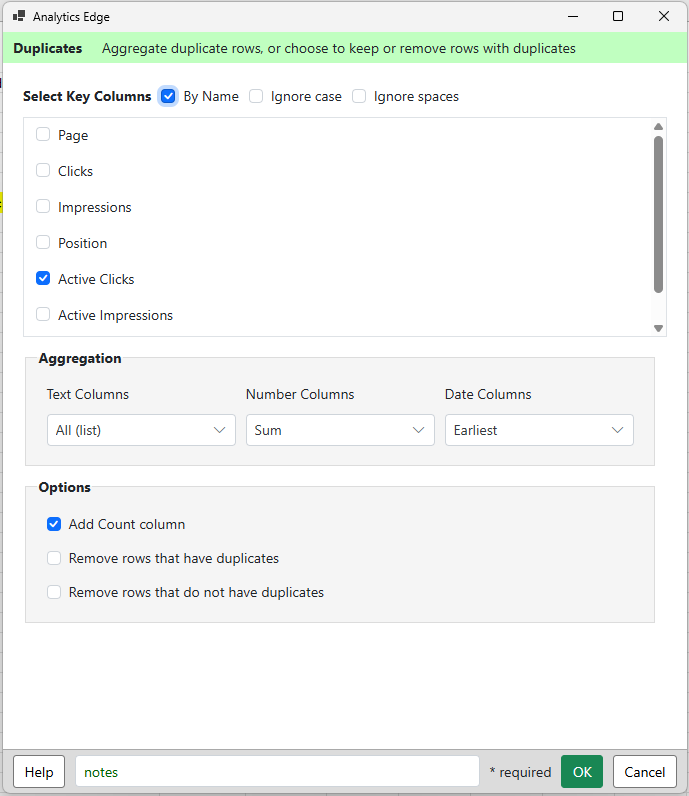
Duplicates with count
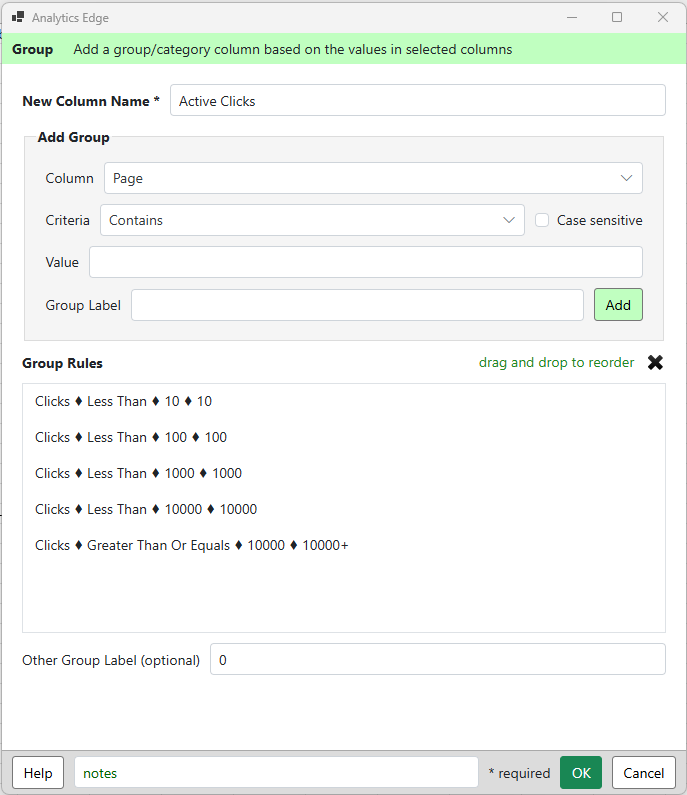
Group by clicks
 The Macro Part 3 – Getting pages from the sitemaps
The ‘_get_pages_from_sitemaps’ macro is a Repeat Macro, which loops through the entries of the _sitemap worksheet. It uses the ReadTextFile function to read the sitemap URL from the internet, then uses Split and Arrange functions to extract the URLs from the XML-formatted content.
TableName is used to hold that list, then it is filtered for other XML URLs (more sitemaps), and they are appended to the _sitemap worksheet. The sitemap being processed is then removed from the _sitemap worksheet by a ReadWorksheet-Filter-WriteWorksheet sequence.
TableName is used to switch back to the unfiltered list of URLs, then any XML sitemap references are removed, leaving only page URLs. Those are appended to the worksheet _pages.
The Repeat Macro function then repeats all of that for the next sitemap.
You now have three summary tables profiling your website’s performance in search, as well as the detailed data behind those summaries.
Analytics Edge does all the work for you.