 When you are looking for a simple way to categorize items, a simple technique is to use cumulative percentage contribution, which is commonly used to demonstrate the Pareto Principle (80/20 rule). In this case, we create 4 simple categories, A, B, C, and D, that each correspond to a percentage.
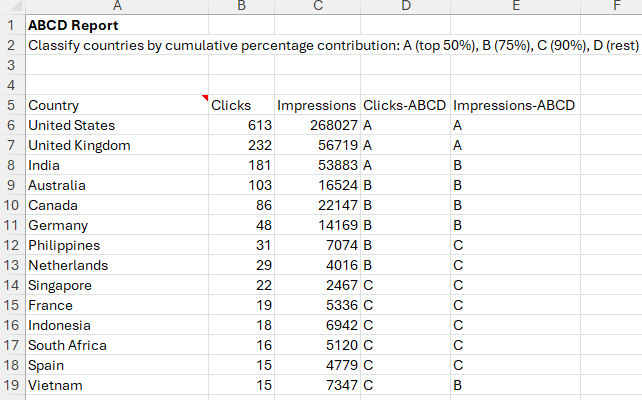
In this example of categorizing search clicks and impressions by country, we used a 50% threshold for A, 75% for B, 90% for C, and the rest for D. Clicks and impressions were ranked separately, letting you quickly see differences in the overall contributions. Category A countries contributed to the bottom 50%, category B up to the 75% level, and so on.
Having a simple categorization scheme like this lets you easily focus your efforts on the largest contributors. It also helps to avoid getting lost in the numbers — the K.I.S.S. principle.
Creating the report with Analytics Edge
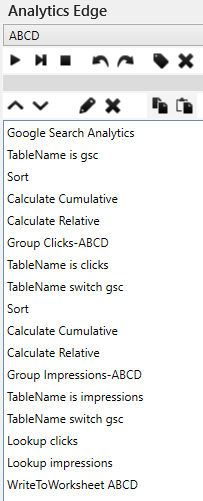 Using Analytics Edge for the analysis starts with a query to get the Google Search Analytics metrics by country. Since we want to analyse by both clicks and impressions, we use the TableName function to hold the query results in memory so we can process each metric separately.
Starting with clicks, we Sort in ascending order, then Calculate cumulative down the column, and Calculate relative to the maximum of the column (image). This gives us a cumulative sum that is normalized to 100% (value of 1 in Excel). A Group function is then used to assign the A/B/C/D category (image) and the TableName function is used to hold the results.
Switching back to the query results (using TableName to return to the previously-saved results), we repeat the process for the impressions metric – Sort / Calculate cumulative / Calculate relative / Group / TableName to hold the results.
Switching back to the query results again to get the original clicks and impressions columns, we then use the Lookup function to pull in the matching country’s category columns for clicks and impressions (image). The final results are then written to the Excel ‘ABCD’ worksheet.
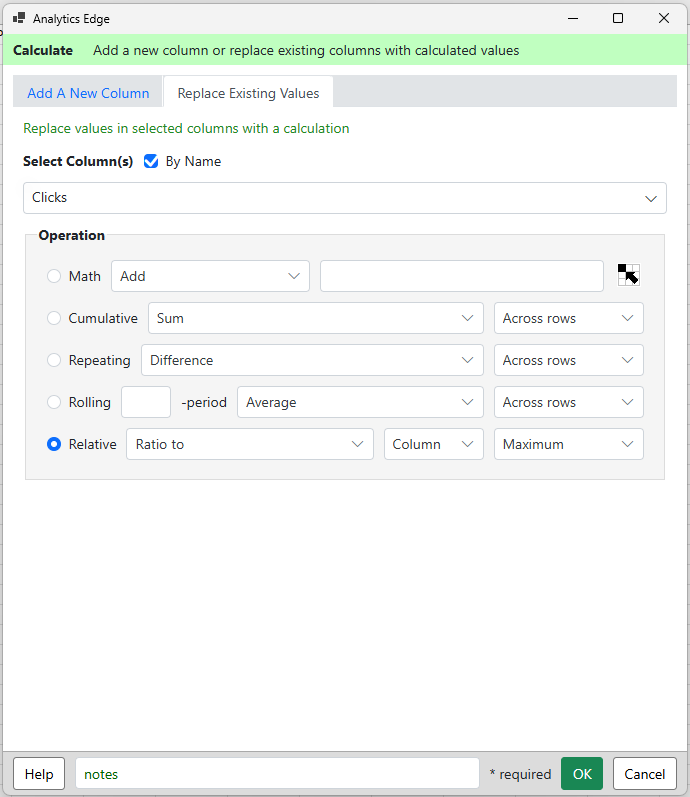
Calculate relative to maximum
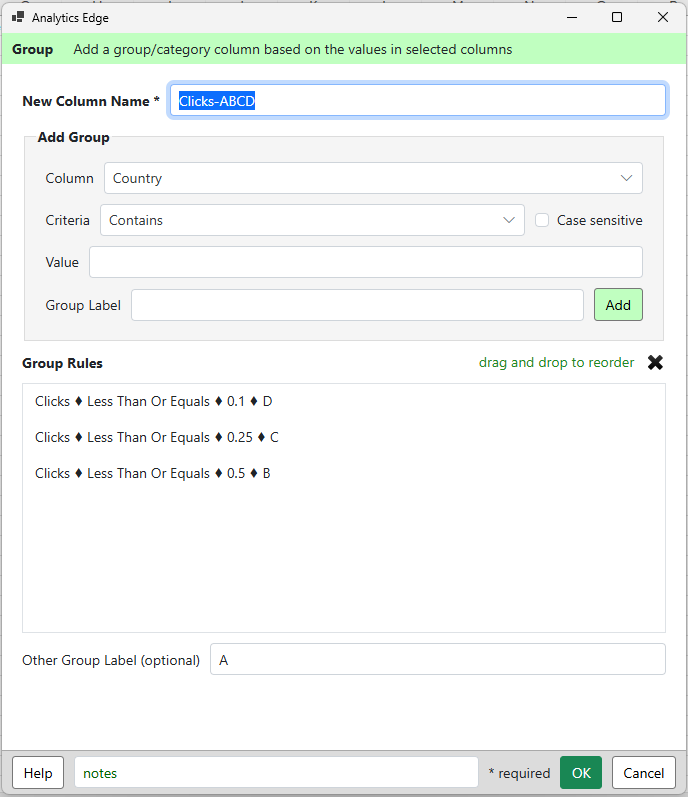
Group into A,B,C,D
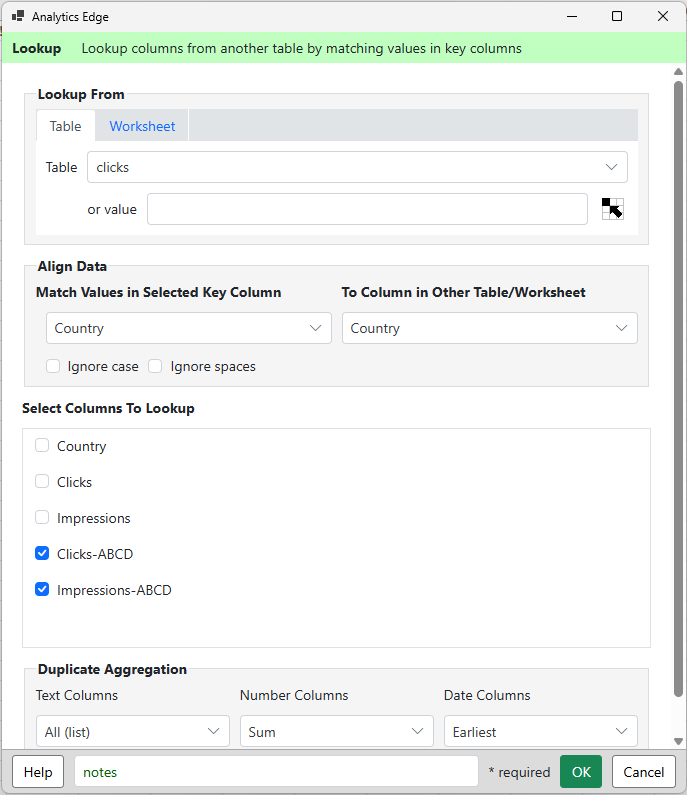
Lookup clicks and impressions
Now it is easy to see which countries contribute the most in clicks or impressions. The same rapid categorization approach can be used with other dimensions or metrics, even with different data sources — so long as the metric can be totalled for the site (which excludes CTR and position).
Analytics Edge makes it easy.