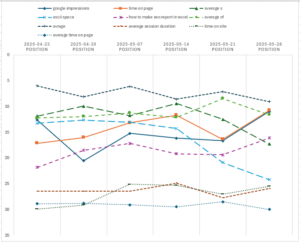
 Most SEO rank tracking reports show a series of top keywords that change very little over time. What you really need to see is which queries made the biggest changes recently. This free report uses Analytics Edge macros to automate the analysis for you.
Download the workbook file: Biggest Position Changes This Week
The workbook includes a setup section where you can enter your account and site values, as well as a few parameters to tailor the report to your site.

The data, when charted, shows the 10 queries whose position changed the most in the past week over the previous week — either better or worse. The previous 4 weeks are included for context. The solid lines have the largest changes, followed by the large-dash, small-dash, and dotted lines. This is simple Excel functionality, so change the chart as you see fit.

The data comes from the Google Search Analytics API, and the additional parameters in the workbook allow you to filter out the noise.
Maximum position: set this level to ignore queries whose peak position over the past 6 weeks did not reach this level. Most people will only be interested in what changed in the top couple of search pages.
Minimum impressions: set this level to ignore queries with low impression counts. The right level for you will depend on the site traffic.
Minimum Diff: set this level to ignore small changes in position. The right level will depend on the amount of variability you have in your query positions from week to week.
The Analytics Edge Macro
 You can follow along in the workbook (link above). The macro starts with a ReadWorksheet function to get the settings and parameters at the top of the sheet. Then it uses the account and site values in a Google Search Analytics function to get the queries for the site for each of the past 6 weeks (up to the most recent date with stable data — a.k.a. the ‘current’ date).
The Total function is then used to get the peak position for each query, and the Filter function is used to get rid of queries that don’t meet the Maximum position and Minimum impressions.
A Calculate function gets the difference between the previous week and the current week, which could be positive or negative. A second Calculate function get the difference between the current and previous, and a Total function will get the maximum of the two, which will always be positive (an absolute value calculation). The Arrange by Position function gets rid of the unnecessary columns and renames the most recent impressions column as ‘Impressions’.
Finally, Sort the results by the (absolute value of the) difference, and Filter out the ones less than the Minimum Diff value. Keep only the top 50 (to prevent an extremely long list) and Write to Worksheet.
Note that you can change the macro to suit your needs; Analytics Edge makes that easy and no programming is required.