 This free workbook includes 15 different SEO reports, each with an Analytics Edge macro to automate the data download and analysis. Inspired by the work of Antoine Eripret’s gsc_wrapper, this collection goes well beyond simple data dumps.
Enter a few values in the Setup sheet, then run the macro of choice to populate the respective report worksheet with your site’s results.
Download the workbook: Common SEO Analytics-2-0.xlsx
Setup
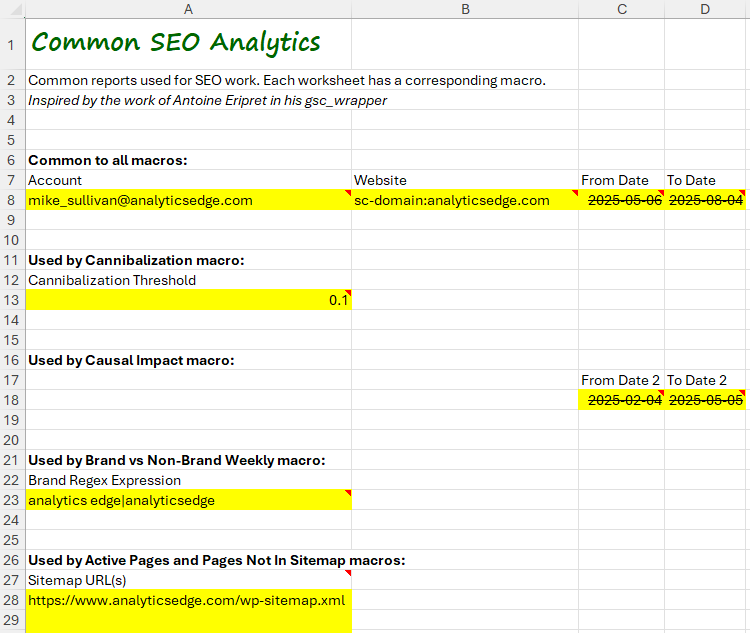 To run a report, first configure the settings in the Setup worksheet.
All reports require an account and website to be specified. Most reports also require a date range (from date / to date).
The Cannibalization reports require a threshold to be specified. Start with 0.1 (10%) and adjust up or down to include more or less content.
The Causal Impact report need a comparison date range (from date / to date). It is typically the same duration as the primary date range to make the report more meaningful.
The Brand vs NonBrand Weekly report requires a regular expression to define the brand queries. If you don’t know regex, you can simply enter your brand name here.
For Active Pages and Page Not In Sitemap reports, you should enter one or more sitemap URLs. These are typically found at https://yourdomain/sitemap.xml and should be listed in your Google Search Console sitemaps section.
The Reports
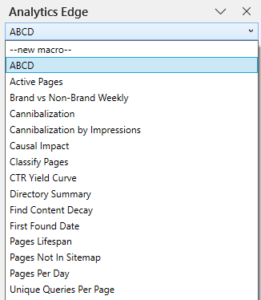
 To run a report, in the Analytics Edge task pane, select the report macro from the dropdown and click the run button.
The results will appear on a worksheet of the same name.
The list below includes links to articles with more detail about how each of the macros work.
ABCD – Classify countries by cumulative percentage contribution: A (top 50%), B (75%), C (90%), D (rest).
Active Pages – For all pages in the sitemap, get the clicks and impressions (if any).
Brand vs NonBrand Weekly – Show weekly metrics for branded vs nonbranded queries.
Cannibalization – Pages with more than 1 page ranking per query, more than 1 page with >N% of clicks for query, query with >N% of clicks for page.
Cannibalization by Impressions – Pages with more than 1 page ranking per query, more than 1 page with >N% of impressions for query, query with >N% of impressions for page.
Causal Impact – Compare clicks before/after a specific date.
Classify Pages – Demonstrates how Group function can be used to classify pages.
CTR Yield Curve – Plot CTR, Clicks, Impressions, and Keyword Count vs Position.
Directory Summary – Summarize metrics per website directory.
Find Content Decay – Pages with >100 clicks and >10% drop in clicks month-over-month.
First Found Date – Show pages most recently receiving clicks in search for the first time in the reporting period.
Pages Lifespan – How many pages appeared in search vs how many days in the reporting period they appeared.
Pages Not In Sitemap – Show pages in search that do not exist in the current sitemaps.
Pages Per Day – Show the number of pages with clicks and impressions per day
Unique Queries Per Page – Show the number of unique queries with clicks or impressions per page.