 Refresh this workbook with Analytics Edge to get your Google Analytics 4 traffic results for the most recent calendar month.
Download the workbook: Google Analytics – Channels 1.0.xlsx
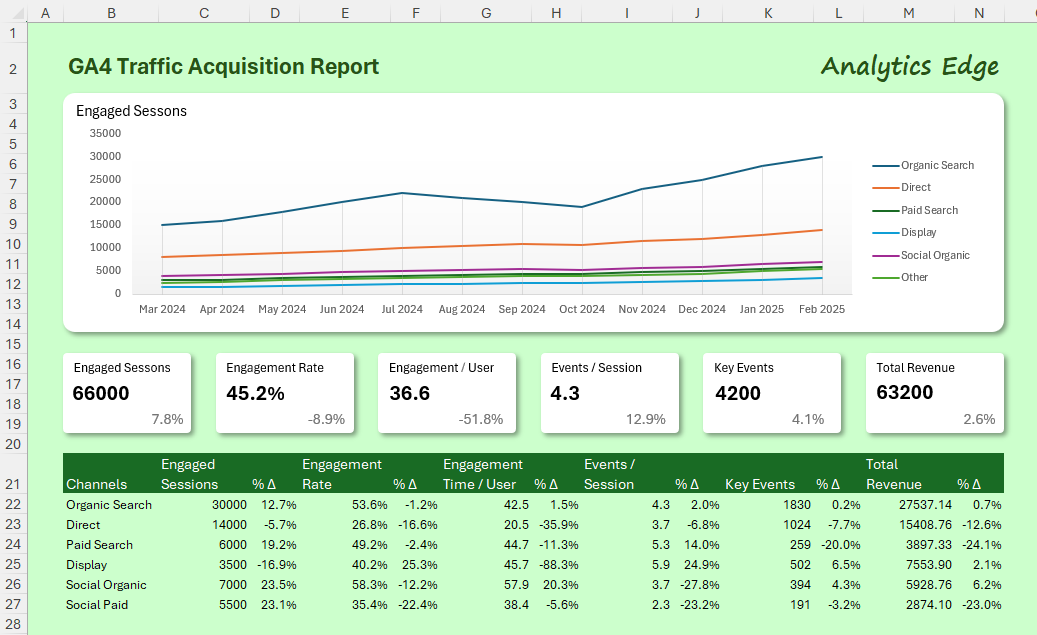
This report mimics the Google Analytics report for Lifecycle > Acquisition > Traffic Acquisition. It shows the last 12 months of traffic by channel (Session default channel group), as well as providing highlights of the most recent calendar month.
Setup
On the Data worksheet, enter the account reference name and GA property ID to use for the query. The account reference name is the one you used when adding a Google Analytics account to the Analytics Edge connector. The property ID is the numeric portion of the property you want to use. Click Refresh All to update the workbook with your data.

How It Works
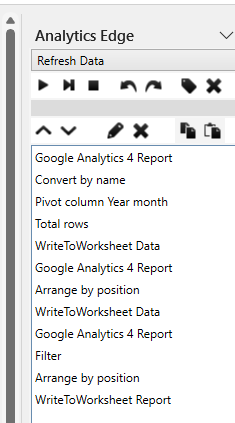 There is one Analytics Edge macro in the workbook that does all the work of updating the data. The macro makes a total of 3 Google Analytics queries to get the data needed.
The first gets the data for the chart. The YearMonth column is converted into a date, and then the Pivot function pivots the date by the month, specifying the column headers with the month and year format desired. That section of the macro ends with using the Total function to create an ‘Other’ row totalling everything beyond the top 5 rows. The data is then written to the Data worksheet at cell B4 for use by the chart.
The next section of the macro pulls in the data for key metric blocks that sit below the chart. It gets data for the last calendar month, as well as a comparison to the previous period with a percentage change column. An Arrange function is used to rename and keep the columns of interest, and the data is written to cell B15 which is pointed to by cell references in the metric highlight blocks.
The final secton of the maco pulls the key metrics by channel for the last calendar month (compared to the previous period) — this is the table at the bottom of the report. Channels without data for the most recent period are filtered out, the columns of interest are kept and renamed, and the data is written directly to the Report worksheet at cell B21.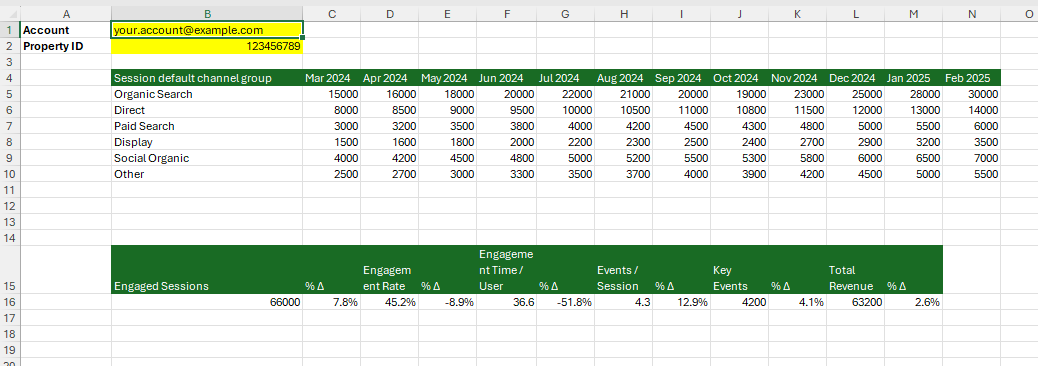
Making It Your Own
The workbook is completely open and everything can be changed to suit your reporting needs. If you want to see how the Report worksheet was formatted, you can watch a video by Kenji Explains (from Career Principles) on YouTube. If you need assistance making changes to the Analytics Edge macro, send an email to support.