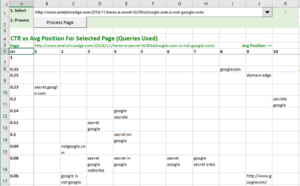
 When embarking on an SEO review for a website, it helps to be able to see what queries are already ranking and how successful they are (click-through rate) at generating traffic. This workbook lets you easily visualize the queries that a specific page ranks for, contrasted to the click-through rate for the past 90 days.
Requires: Analytics Edge Add-in with Google Search connector
Download the workbook: GoogleSearch-CTRAnalysis-2-0.xlsx
The macros in this workbook perform the following functions:
1. get data [ run when you click Refresh All ]
- get the past 90 days of data from Google Search Console for your website.
- stop the macro if there was a query error (no results)
- write the results to the worksheet Data
- arranges the columns in a specific order (dropping the ‘query’ column)
- combines duplicate ‘page’ rows, summing clicks and impressions
- sorts the data by the now-combined clicks and impressions
- writes the results to the Top Pages worksheet
The workbook uses a button that runs an Analytics Edge macro.
_ProcessPage [ run when you click Process Page button ]
- reads the page to be processed from worksheet cell B5
- reads the Data worksheet
- filters the data for the page selected
- rounds the ctr and position columns to 2 and 0 decimal places
- sorts the data by ascending position and descending ctr
- pivots the position to the columns, and query strings to the cells
- sorts the table by ctr ascending
- writes the final results to the worksheet