 Refresh this workbook with Analytics Edge to get your Bing Webmaster Tools results for the most recent calendar month.
Download the workbook: Bing Webmaster Tools Overview 1.0.xlsx
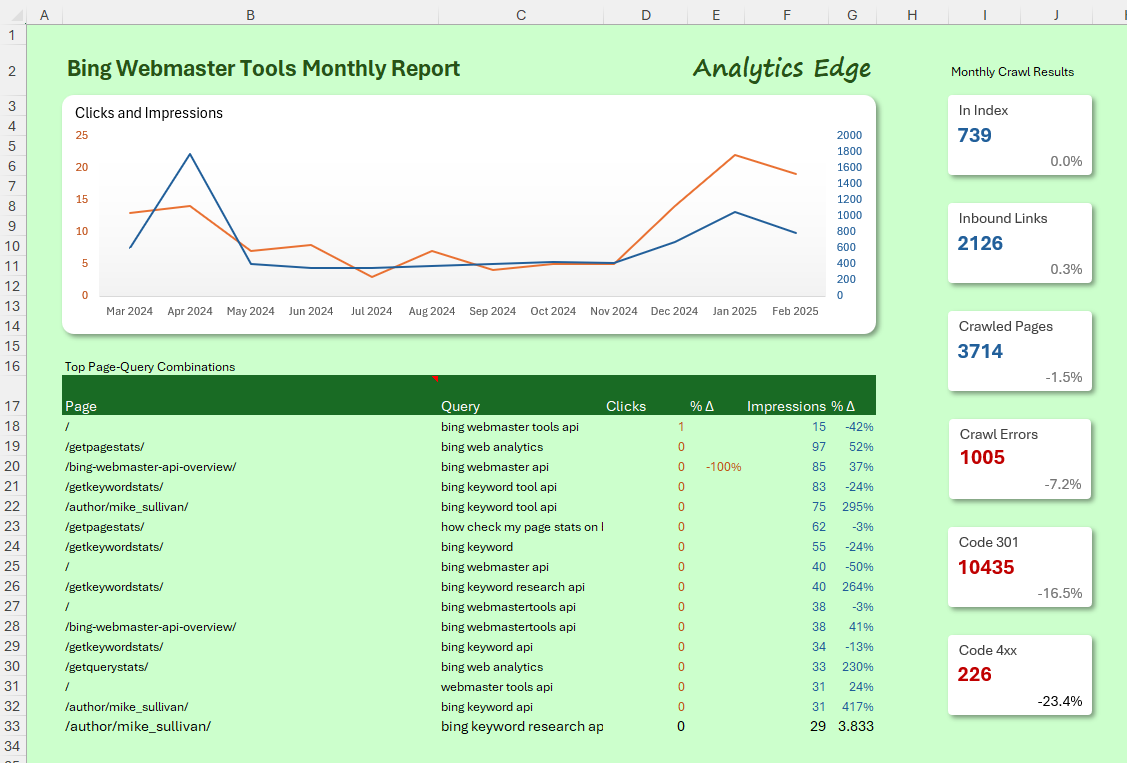
This report provides an overview of your website Bing search presence. It shows the 12-month trends for clicks and impressions, as well as last month’s crawl statistics. It also includes a table of the top page-query combinations and their month-over-month performance.
Setup
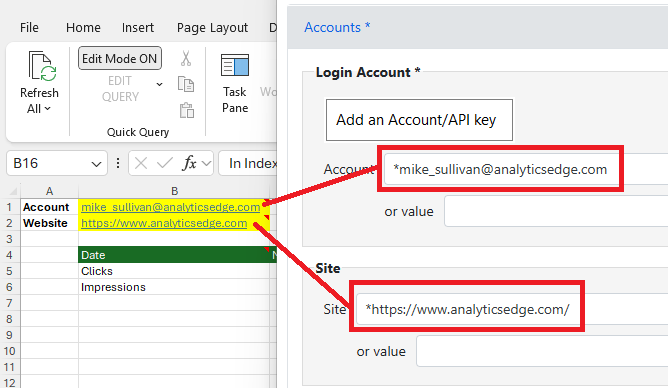
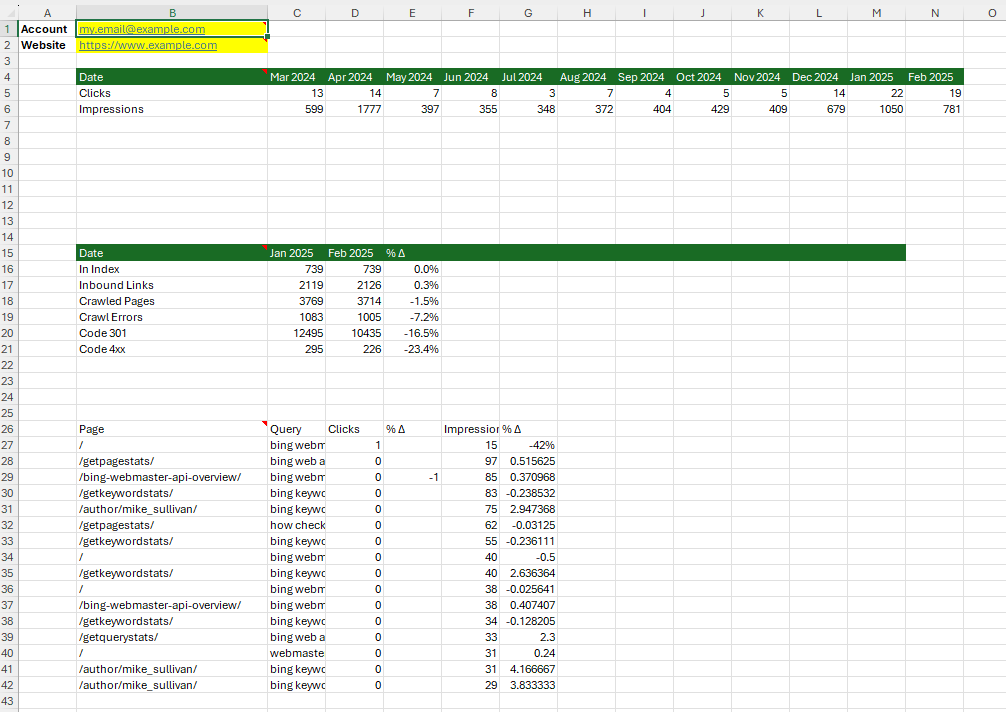
On the Data worksheet, enter the account reference name and website to use for the query. The account reference name is the one you used when adding a Bing Webmaster account to the Analytics Edge connector. The website is the entry as seen in the query wizard. Click Refresh All to update the workbook with your data.
 How It Works
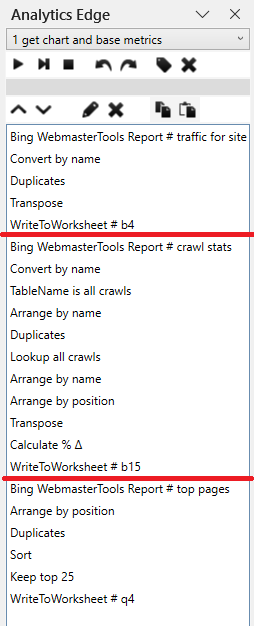
There are 3 Analytics Edge macros that do all the work. When you click Refresh All, they run in alphabetical order, so they are named as 1… , 2… , and 3… . Note that the Bing API supplies data on a daily or weekly basis, depending on the report type, so the macros have to transform it into monthly summaries.
Need help with a macro? No problem - just contact support.
The first macro has 3 sections, each starting with a query. The first section pulls the data for the chart. Traffic stats is delivered by day, so the date is converted to a month label, then a Duplicates function is used to sum the clicks and impressions per month. Then the data is transposed to a more conventional orientation before writing to the Data worksheet. The chart on the Report sheet references this data.
The second section pulls crawl statistics on a daily basis. Again, the date is converted to a month label. A couple of the columns contain numbers that are total counts that change slightly from day to day (like the number of pages in the index), while others (like crawl errors) are daily counts. For the total count metrics, we take the maximum value over the month, while for the daily count metrics, we sum the daily numbers. This is accomplished by a combination of Arrange, Duplicates and Lookup functions. The result is then transposed and delta percentages are calculated before being written to the Data worksheet. The highlight cards on the Reports sheet use cell references to this table.
To get the data for the top Page-Query combinations table, we need to first get the top pages, then for each of those pages get the top queries, and finally summarize all that data. This 3-step process is accomplished by the last section of the first macro and the other 2 macros.
The last section of the first macro pulls the top pages for the last calendar month, which are delivered in weekly numbers. The date is dropped and the Duplicates function is used to get page totals for the month, which are then sorted and the top 25 are written to a scratch-pad area on the Data worksheet (Q4).
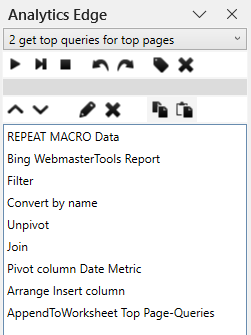 The second macro is a Repeat Macro, and it repeats for each of the top pages in the scratch pad list. Before running, it clears the data on the Top Page-Queries worksheet. The macro gets the queries for the selected page, processes them and appends the results to the Top Page-Queries worksheet, resulting in a sheet of queries for each of the top pages.
The repeat macro starts with a Filter command that skips the loop if there is no query detail for that page (which can happen). The date column is then converted into a month label.
The data at this point contains 2 month’s worth of numbers, so the next few functions transform the Clicks and Impressions columns into 2 sets of columns, one for each month. This is accomplished with the Unpivot, Join and Pivot functions — the Pivot function also de-duplicates the months and sums the clicks and impressions for each month. The macro then ends by inserting a new column containing the selected page, and the appending to the Top Page-Queries worksheet.
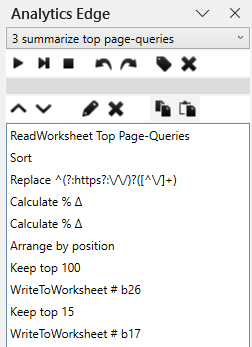 The third macro reads the big Top Page-Queries sheet, sorts it and cleans up the page Urls with a replace (regex) function. Delta columns for the Clicks and Impressions are calculated and the columns are renamed and arranged before writing the top 100 to the Data worksheet and the top 15 to the Report worksheet. Note we did not use cell references on the Report sheet for this since page Urls and queries can be wider than the space in the report column — using cell references would prevent a simple click on a cell from showing the full Url or query.
Make It Your Own
The workbook is completely open and everything can be changed to suit your reporting needs. If you want to see how the Report worksheet was formatted, you can watch a video by Kenji Explains (from Career Principles) on YouTube. If you need assistance making changes to the Analytics Edge macro, send an email to support.