 Refresh this workbook with Analytics Edge to get your Google Search Console results for the most recent calendar month.
Download the workbook: Google Search Console Overview 1.0.xlsx
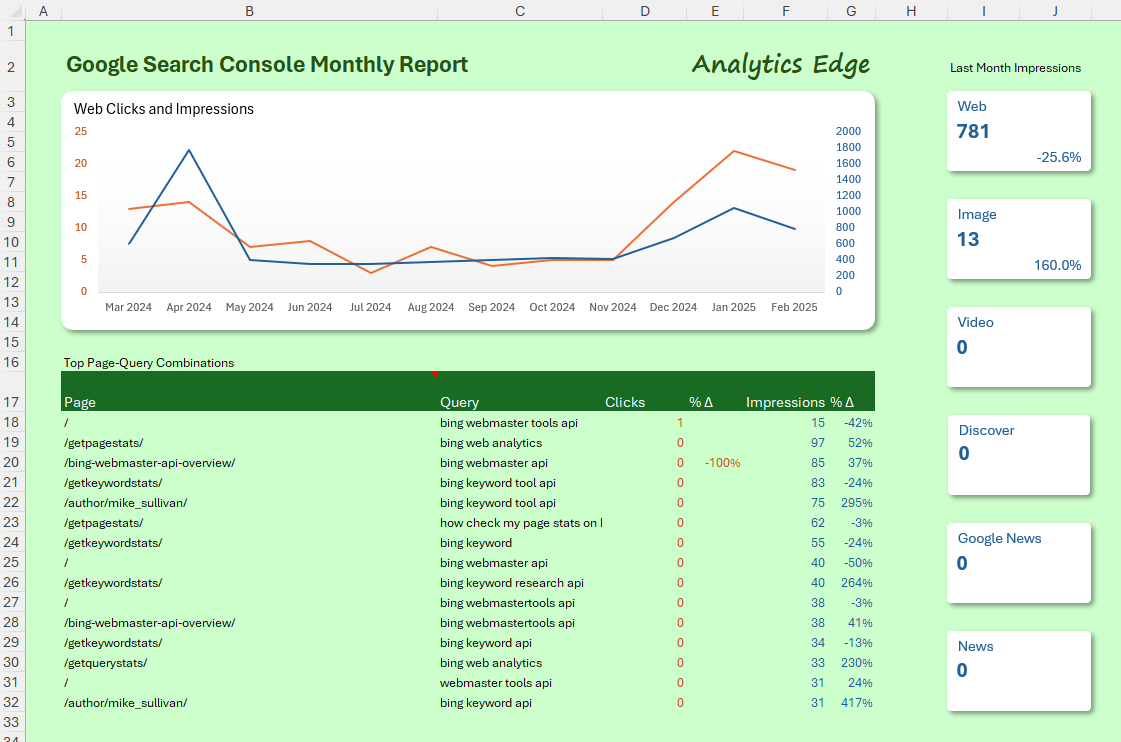
This report provides an overview of your website search presence. It shows the 12-month trends for web clicks and impressions, as well as last month’s impressions for all 6 search types. Also included is a table of the top page-query combinations and their month-over-month performance.
Setup
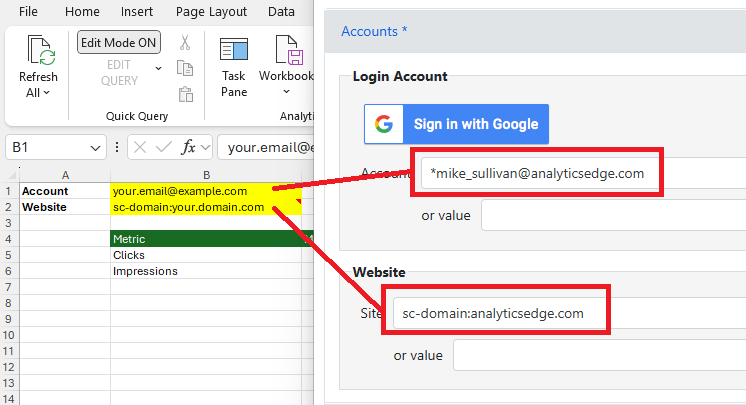
On the Data worksheet, enter the account reference name and website/domain to use for the query. The account reference name is the one you used when adding a Google Search account to the Analytics Edge connector. The website/domain is the entry as seen in the query wizard. Click Refresh All to update the workbook with your data.
 How It Works
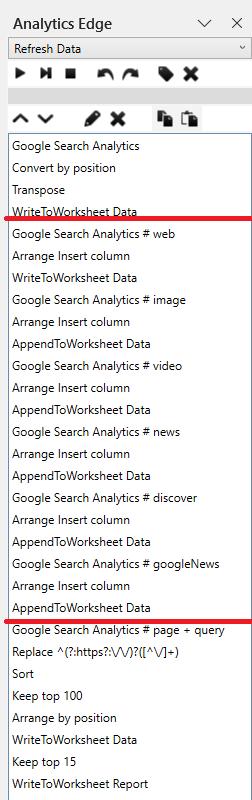
There is one Analytics Edge macro in the workbook that does all the work of updating the data. It is a relatively long macro, and it does a few things that deserve an explanation.
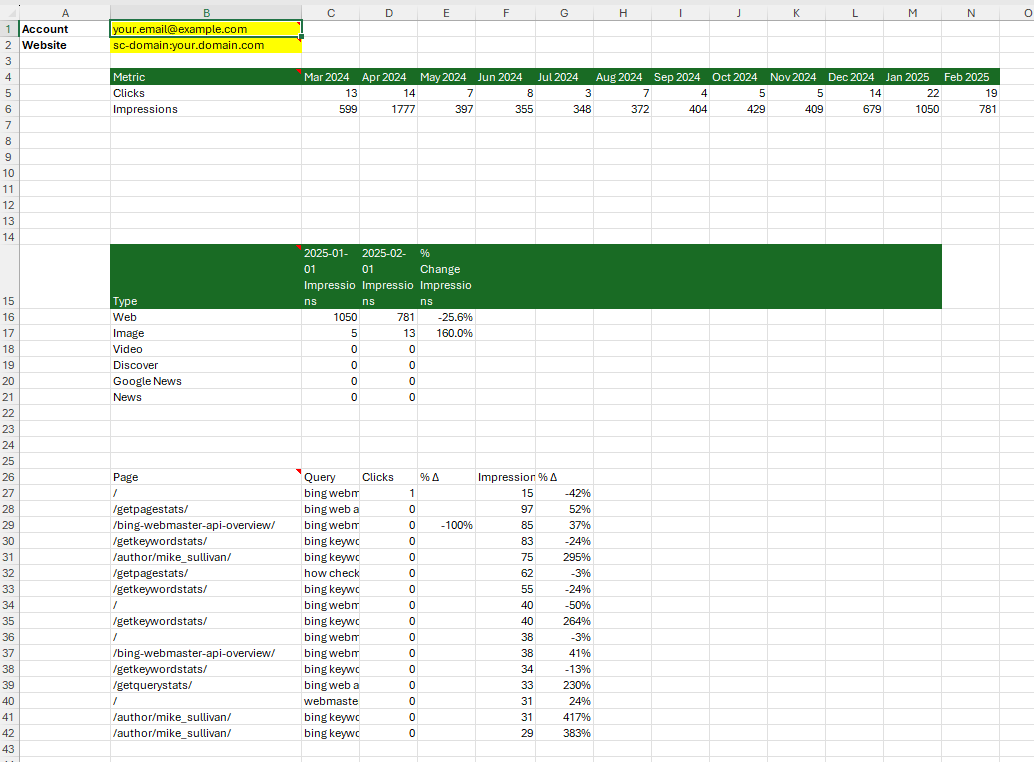
The first section produces the data for the top chart. It pulls clicks and impressions by month. The Convert function is used to change the date format, and the Transpose flips the x-y axis to be more conventionally oriented. The chart on the report sheet uses this data.
The next section includes 6 queries, one for each search type. This is for the 6 highlight cards down the right side of the Report sheet. The Arrange function is used to insert a label column prepopulated with the type label. The first query writes to the Data worksheet, and subsequent queries use Append To Worksheet to build on that data. Each highlight card has cell references to this table.
The final section pulls the page and query combinations for the most recent month. To shorten the Urls in the page column, a regular expression is used in a Replace function to strip off the domains portion. The data is sorted by the more recent month’s clicks and impressions, and the top 100 are kept. An Arrange function is used to rename and keep only the columns of interest before the list of 100 is written to the Data worksheet. The Top 15 is then pulled out and written to the Report worksheet. Note we did not use cell references for this since Urls and Queries can be wider than the space in the report column — using cell references would prevent a simple click on a cell from showing the full Url or Query.
Making It Your Own
The workbook is completely open and everything can be changed to suit your reporting needs. If you want to see how the Report worksheet was formatted, you can watch a video by Kenji Explains (from Career Principles) on YouTube. If you need assistance making changes to the Analytics Edge macro, send an email to support.