Google released new guidance on how to collect and report Core Web Vitals using Google Analytics 4, but the approach makes use of some pretty complicated concepts with BigQuery. In this article, I want to show you how to make similar reports in Excel using Analytics Edge with a lot less work and complexity. More
Helpful Articles (filter at right)
Sistrix API Query – No Connector Needed
 The Sistrix API uses an ‘API Key’ (secret code) to authenticate their API queries; the Analytics Edge Add-in can easily automate your downloads using the ‘Read Text/Web File’ function — no connector required! More
Splitting a Column Into Multiple Rows
It may sound like a simple request, but splitting a column into rows is something you can’t do in Microsoft Excel without resorting to Visual Basic programming or using an add-in, like the Analytics Edge Add-in. More
Story: Computers Should Automate Tedious Tasks
Do you find yourself becoming a slave to the computer? That is not how it is supposed to be. This is the first of a new series of articles where I share some of my life lessons; I hope you enjoy and benefit from them. More
Terminology
The Analytics Edge Add-in uses some common Microsoft Excel terminology, but the meanings are slightly different. More
Tips for Google Analytics Reporting
Analytics Edge makes it easy to get data from Google Analytics into Excel, and here are a few tips to make it easier to build impressive reports. More
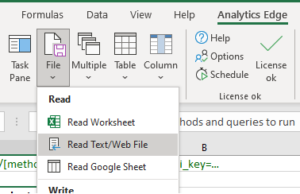
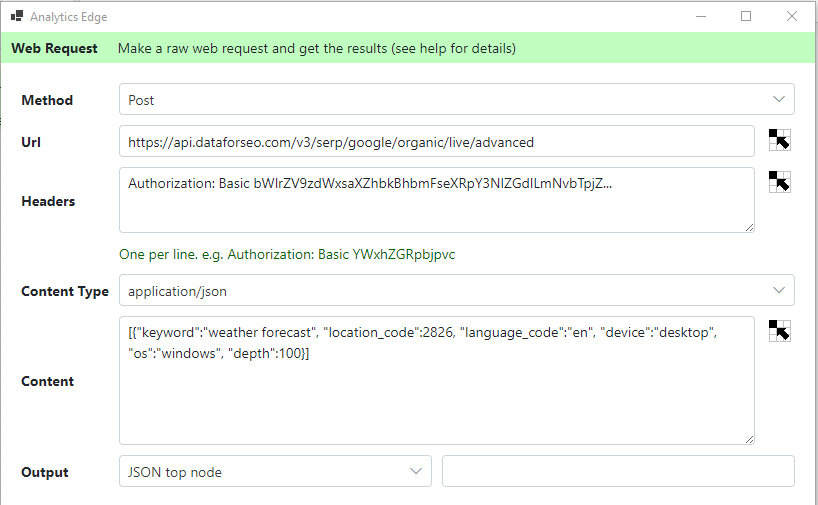
Use Web Request Function To Query DataForSEO API
This article shows how to use the Analytics Edge ‘Web Request’ function to make an API query, using the DataForSEO API as an example (a free trial of the API is available). The same approach can be used for other API’s that use simple authentication schemes.
Using Append to Worksheet
The Analytics Edge Add-in allows you to append the results of a query to the existing data in a worksheet. While the function is simple, there are some scenarios where you can experience problems. This article describes the problems you could experience and the solutions. More
Using Excel Tables With Analytics Edge
It may not be obvious, but the Analytics Edge add-ins support the use of Excel Tables (and linked PivotTables). Not sure what an Excel Table is? Chandoo.org has a good introductory article to this powerful Excel feature. More
Using Interactive Range Names
 When you use Analytics Edge in the Interactive mode, the data from the selected workbook is available for the wizard you open. For some wizards, like the new Google Search connector’s URL Inspection query, this allows you to process multiple URLs at once. More
Using the Append Function
 The Analytics Edge add-in lets you easily append data from one table to another, aligning the common columns but appending the new rows to the bottom. More
Using the Arrange Function
 The Analytics Edge add-in for Microsoft Excel lets you easily rearrange or rename columns in your report. More
Using the Combine Function
 The Analytics Edge add-in lets you easily combine data from two tables, aligning the common rows in key columns, and aggregating the cell values in other columns. More
Using the Compare Function
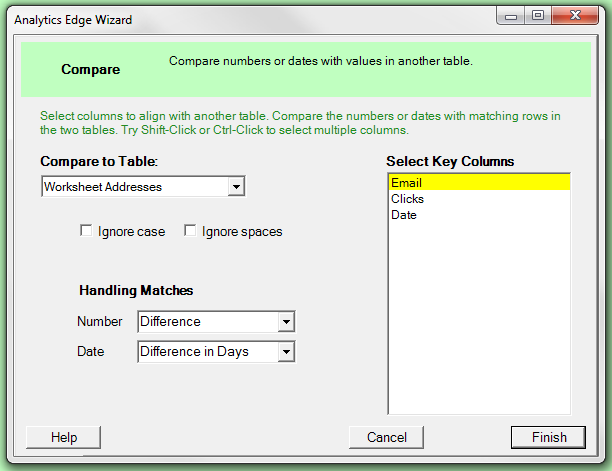 The Analytics Edge add-in lets you easily compare data from one table to another, calculating growth or change in numbers as well as time differences in dates. More
Using the Convert Function
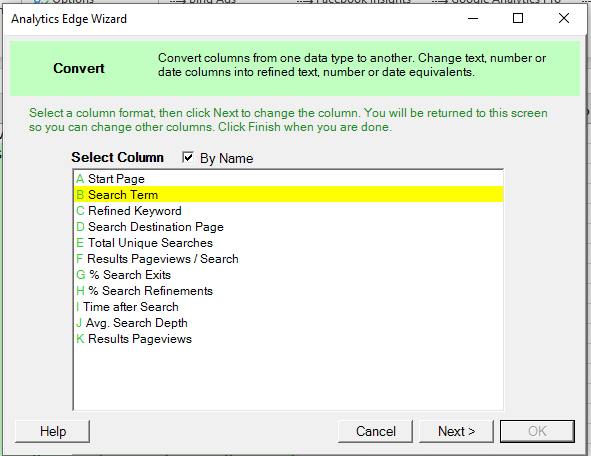 The Convert Function of the Analytics Edge Add-in lets you convert text, numeric and date columns in a wide variety of ways. This article describes how it can be used in your Analytics Edge macros. More
Using the Duplicates Function
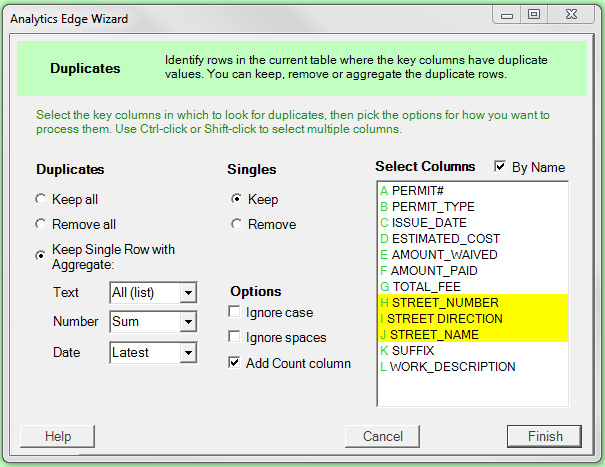 The Analytics Edge add-in for Microsoft Excel lets you easily combine rows with identical values in some of the columns. More
Using the Filter Function
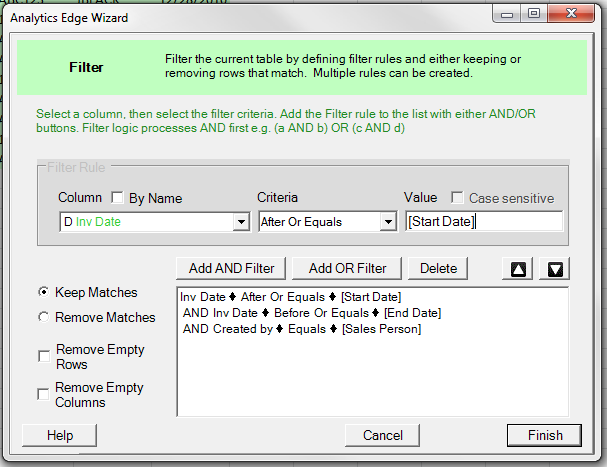 The Analytics Edge add-in for Excel lets you easily filter data in a table. More
Using the Group Function

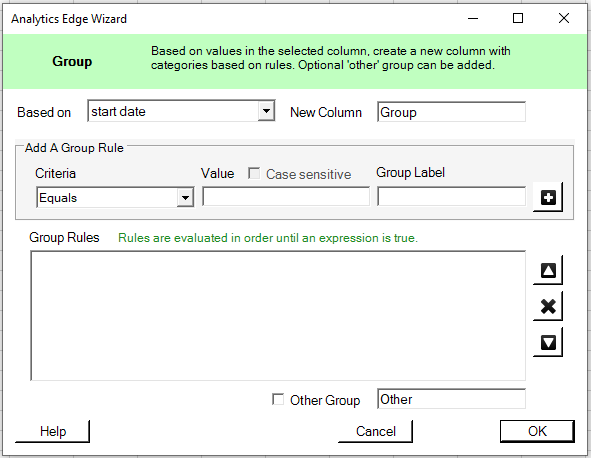 The Group function in the Analytics Edge add-in lets you easily group or categorize data. It evaluates the values (text, numbers or dates) in a selected column, and adds a new column with group or category labels. The simple wizard interface gets the job done in seconds. More
Using the Match Function
 The Analytics Edge add-in lets you keep or remove rows from one table if matching values exist in another. More
Using the Pivot Function
 The Analytics Edge add-in for Excel lets you easily pivot data without the complexity of an Excel pivot table. More
Using the Read Worksheet Function
 With the Analytics Edge add-in for Microsoft Excel, you can easily include data from existing worksheets in your automation macros. More
Using the Repeat Macro Function
The Repeat Macro function in Analytics Edge lets you cycle through a list of items, repeating the rest of the Analytics Edge macro for each line in the source list. This article shows you how to use it. More
Using the Run Macro Function
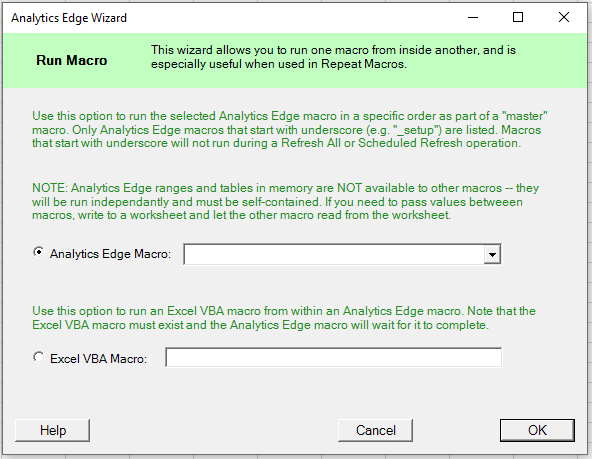 The Run Macro Function in the Analytics Edge Add-in lets you run other Analytics Edge macro or Excel VBA macros. This would typically be used to create a ‘master’ macro that runs through a specific sequence of other macros. With v7 of the Add-in, you can also trigger Excel VBA macros, which opens the door to running custom VBA code that does things Analytics Edge does not enable. More
Using the Update Function
 The Analytics Edge add-in lets you easily update one table with values from matching rows of another table. More
Using Worksheet Values to Determine Reporting Period
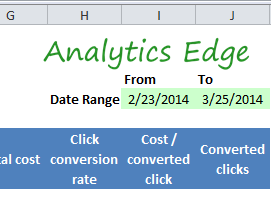 This article explores how to use date values in your Excel workbook to drive Analytics Edge connector queries, opening the door to a more interactive reporting experience within Excel. More
Using [Range Names]
Report automation goes to a whole new level when you discover [range names] in the Analytics Edge Add-in! This capability is embedded throughout the product, and it allows you to grab values from your data to be used in subsequent functions, like filtering one query based on the result of another query. More
Write the Results into Excel
The Analytics Edge Add-in is holding your query results in memory, where you can easily manipulate it with other Analytics Edge functions. When you are ready, you will want to write the results into an Excel worksheet. More
Year-Over-Year Comparison in One Query
Here’s a neat little technique you can use to get year-over-year comparisons in one query with the Google Analytics Pro connector from Analytics Edge. More
Year-Over-Year Reporting
If you are trying to build a Google Analytics report comparing one year to the previous one, you can use the Pivot operation to make charting easier. The trick is to choose your dimensions wisely. More