This is the main data exploration panel, and it is designed to be fast and easy to use but some of the features are not obvious.
Noteworthy:
- Search Console data contains site and page-level data; if you select a page-related dimension, page-level metrics are displayed.
Date Ranges
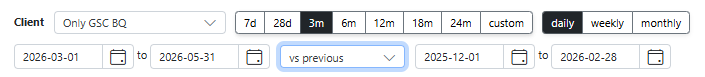
You can select from the preset date ranges at the top or set the start and end dates manually. You can compare to previous preriod or previous year, or set the comparison dates manually.
If you change to weekly or monthly buckets, the date ranges may shift slightly to provide complete 7-day or monthly periods.
Charting Metrics
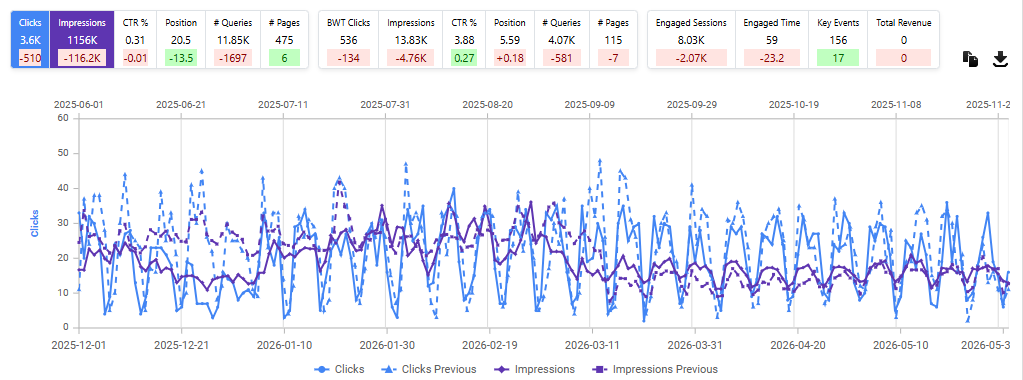
The dashboard tiles at the top will show the current totals for each of the metrics. If you have a date comparison active, a delta-to-current will also appear. The chart will show all selected metrics, and while it is easy to add too many metrics to follow in the chart, the underlying data is available to copy or download via the buttons in the upper right.
Turn on/off lines – Individual lines in the chart can be turned off or on by clicking on the legend entries at the bottom.
Drag to zoom – if you want to zoom in to focus on a specific time period, you can drag the cursor across the chart.
Hover for details – hover the mouse over the data to see the values for that specific date.
Position axis – if you select a position metric, it will use a secondary axis on the right that is reversed (0 at the top) and the scale is fixed (max 50) for consistency.
Filters are active – note that if you filter the data below, the tiles and the chart will also be filtered, and this may result in some odd-looking charts.
Dimensions and Data Grid
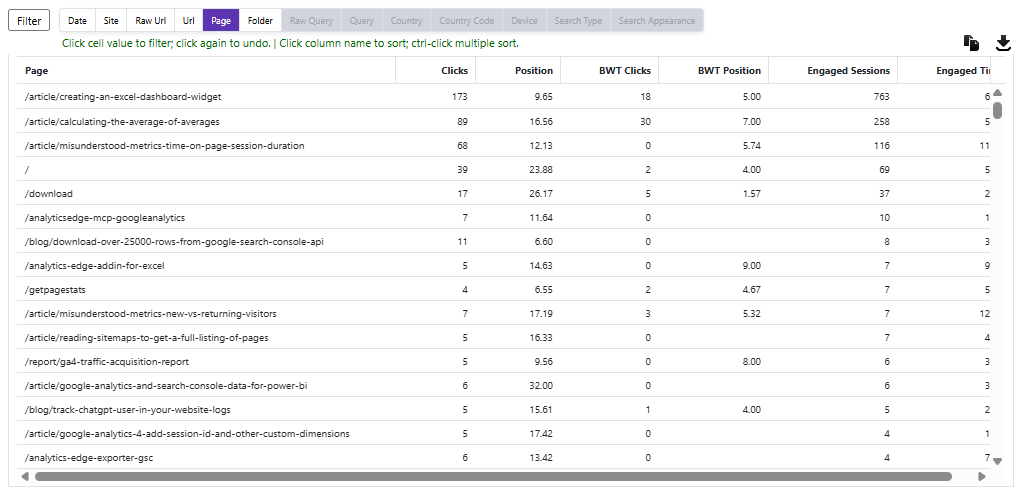
The list of dimensions is context sensitive, so some selections may be disabled as other things are selected. The table below lists all selected dimensions and metrics. If a date comparison is selected, the table also includes Previous and Delta values.
Click to sort – clicking on a field name in the header row will sort the table by that field. Clicking a second time will reverse the sort order. Clicking again will turn off the sort.
Multi-column sorting – to sort on multiple columns, Ctrl-click on the second and subsequent column names.
Click to filter – click on a column value to filter on that value.
- for dimension columns, it will filter for that specific value; if the cell if empty, it will filter for cells that are NOT empty.
- for metric columns, it will filter for cells greater or equal to that value; for position columns, less than or equal to.
No row limit – the data grid at the bottom uses virtualization, so there may be some lag when scrolling large data sets.
Advanced Filter
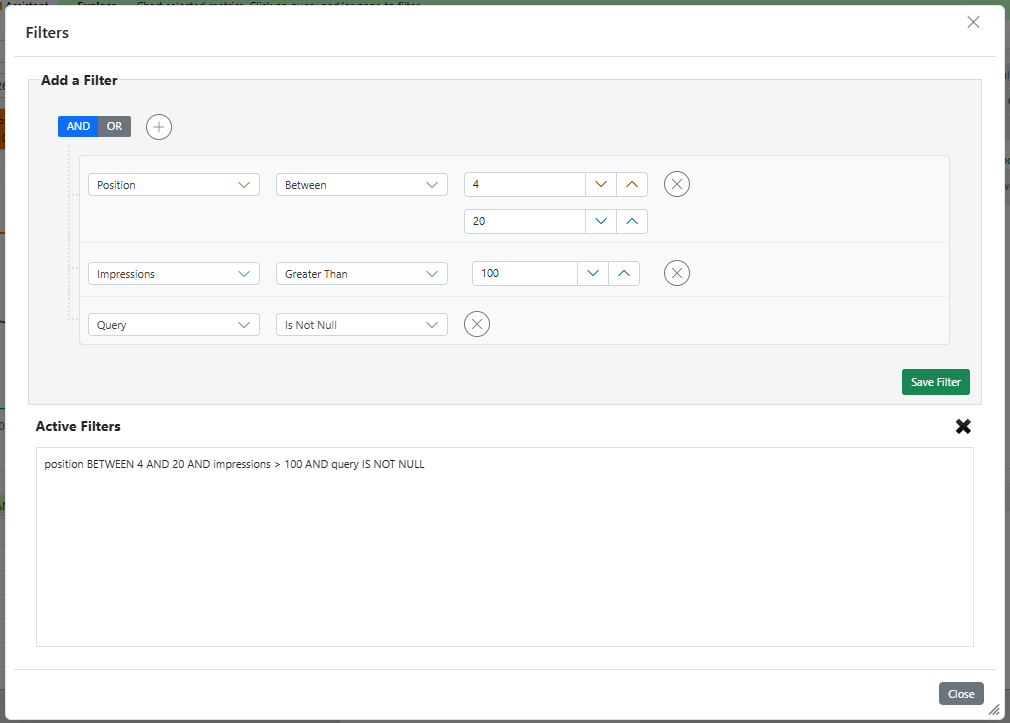
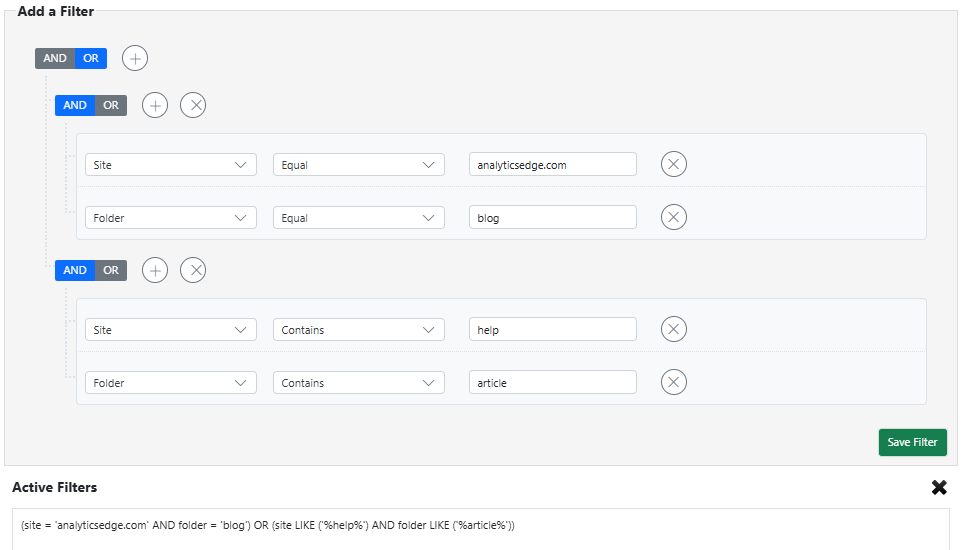
Clicking on the Filter button beside the dimensions will open the advanced filter panel. You can edit existing filters or add new ones.
This panel supports complex and/or filter combinations with multiple groups of multiple conditions. For example, to get blog pages from one subdomain, and article pages from another, you create a group for each combination and OR them.
Saved Reports
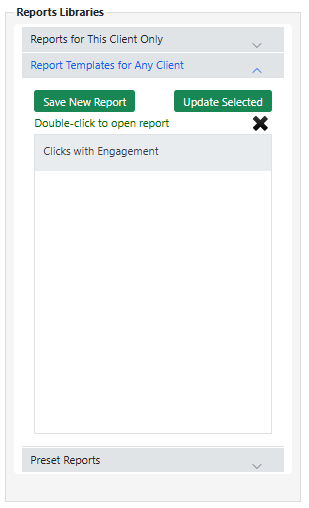 Finally, the current selections can be saved as a ‘report’ at any time. These reports are available in the right side panel.
Reports for This Client Only – if the selections/filters are specific to a client, you can save the report for that client only. Double-click on an entry to open it.
Report Templates for Any Client – if the report is generic and can be applied to more than one client, you can save it as a template. Double-click on an entry to open it.
Preset Reports – a list of packaged reports you may find useful. Double-click on an entry to open it. Note that you can load a preset report, change it, and save it as your own template.
Save New Report – saves the current selections with a new name in the list.
Update Selected – saves the selected report in the list. Note than you can change the name as well.