 Download your data for a GA4 Realtime report. This wizard lets you select an account and GA4 property. select the fields, filters and sort criteria for the report.
GA4 Realtime reports show traffic in the last 30 minutes.
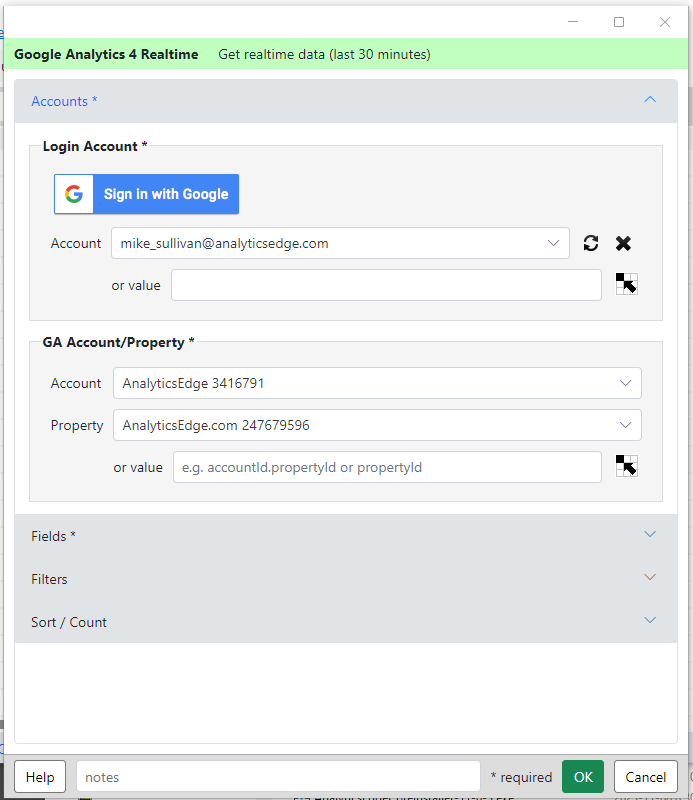
Accounts Section
Login Account – Add a new account using the Sign in with Google button to authorize the connector to your Google Analyics account, or select a previously saved account. You can also refresh the selected account (in case the saved security token stops wotking), or delete the entry.
or value – you can use a cell reference to get the account name to use. Click the button to select a cell in the spreadsheet.
GA Account/Property – select the Google Analytics account and property to use.
or value – you can use a cell reference to get the ga4 property id to use. Click the button to select a cell in the spreadsheet.
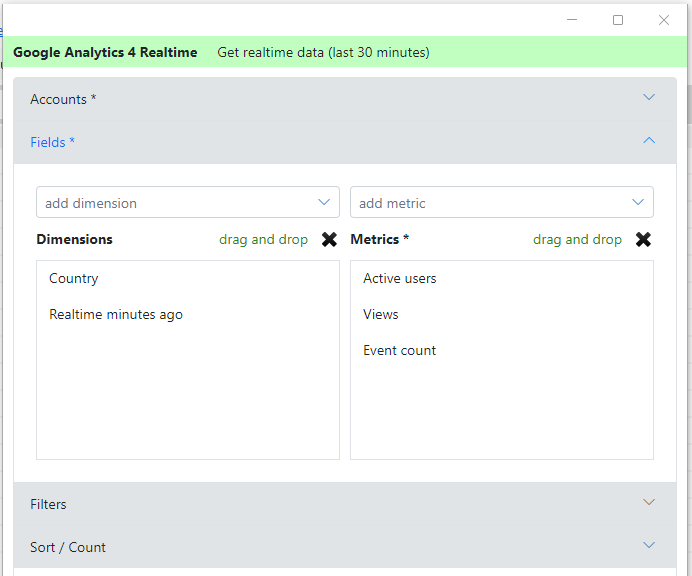
Fields Section
Dimensions / Metrics – select the ‘add dimension’ or ‘add metric’ control to open a drop down to pick a dimension or metric for the report. Start typing to filter the list. Selecting an entry adds it to the selected fields lists.
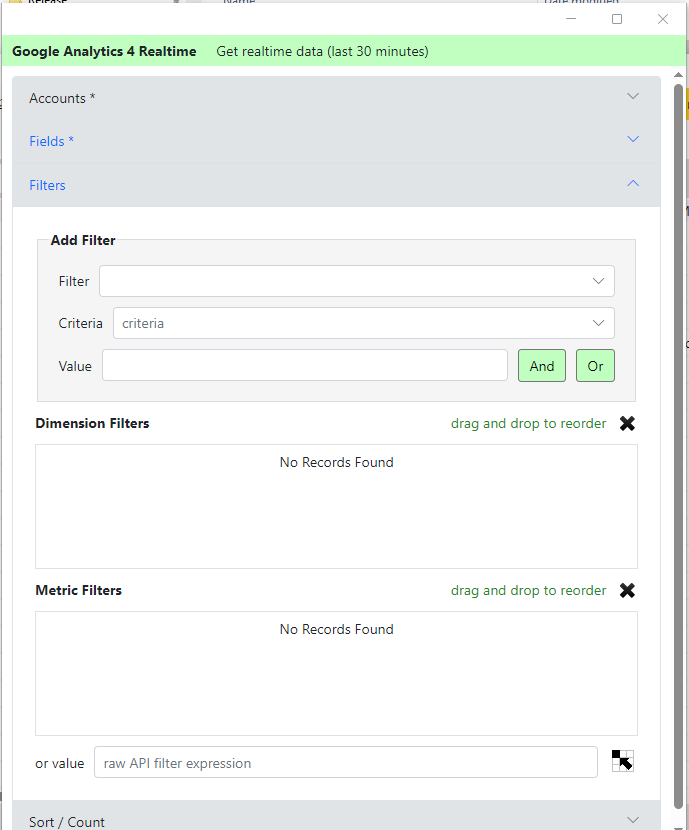
Filters Section
Add Filter – select a field, criteria and value for a new filter, then click And (or Or) to add that criteria to the current dimension filters or metric filters.
or value – you can use a cell reference to get the raw filter expression to use. Click the button to select a cell in the spreadsheet. Raw filter expressions are sent to the API as-is. ref: https://developers.google.com/analytics/devguides/reporting/data/v1/rest/v1beta/FilterExpression
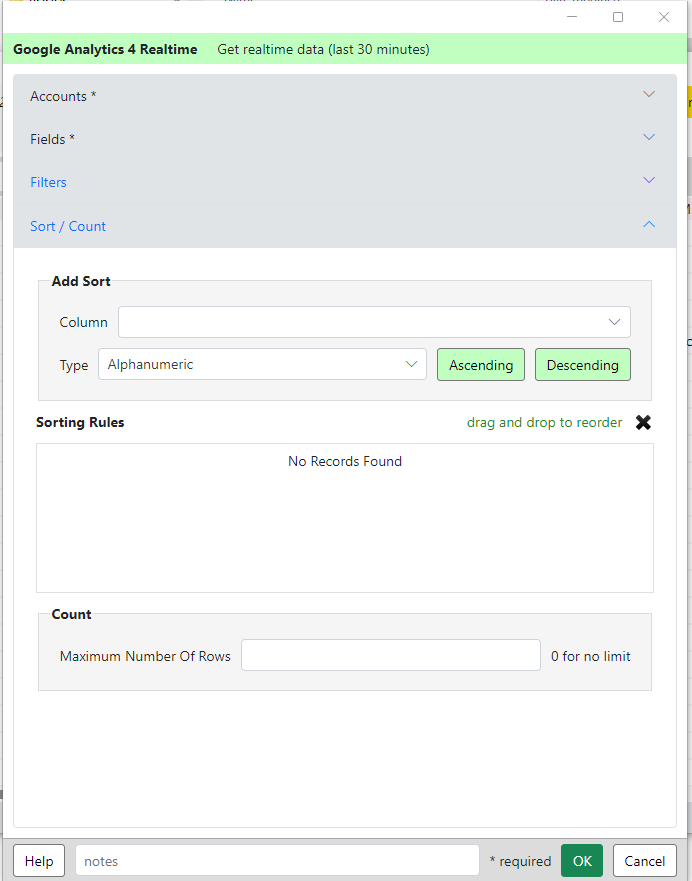
Sort / Count Section
Add Sort – select a column and the type of sort desired, then click Ascending or Descending to add the sorting rule to the current list.
Count – to limit the number of rows returned, enter a number. By default, all rows available will be returned.