 The Analytics Edge add-in for Excel lets you easily pivot data without the complexity of an Excel pivot table. The simple wizard interface lets you choose the rows, columns, value and aggregation to use, and has extra features for generating trend reports. Use it in combination with other Analytics Edge functions to automate your Excel reports updates.
Why would you use a pivot function
Downloaded or imported data is usually provided in a column format with one row per event, item or transaction. While it is easy to Subtotal the information to see things like the total number of link clicks per campaign, if you wanted to see a summary of all the actions by campaign (segmentation) or link clicks by hour for each campaign (trending), you would need to pivot one of the dimensions (values in the action or date column).
While Excel provides a powerful pivot function, many find it overly complicated and difficult to work with. Because Analytics Edge lets you combine several functions in an analysis macro, the pivot function itself is kept simple and easy to use.
Using the Pivot function
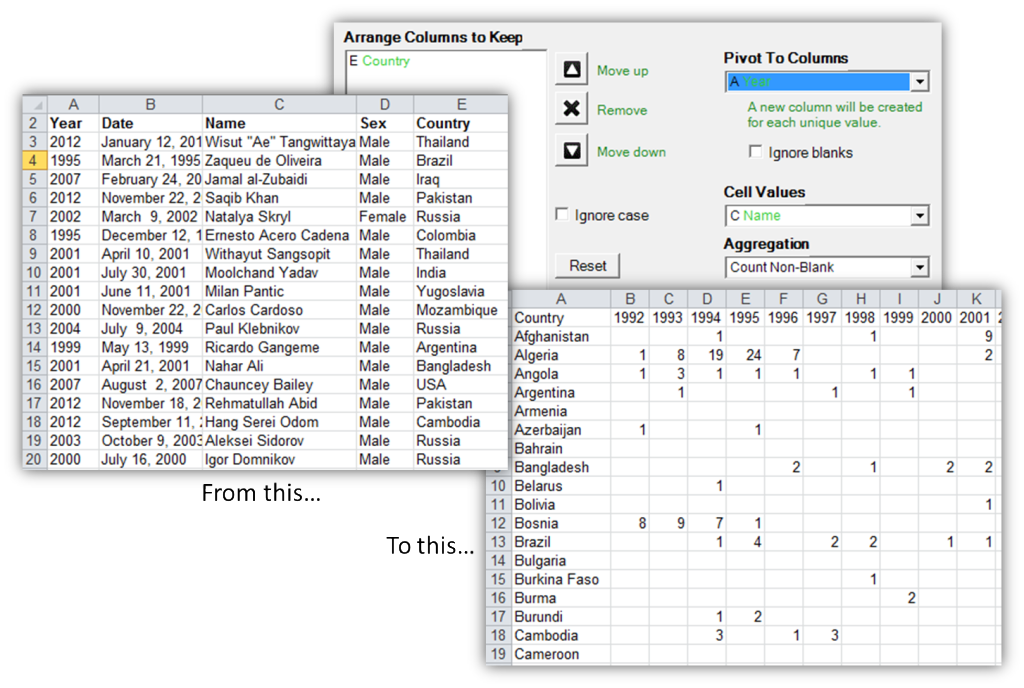
Once you have loaded your data with the add-in, the Pivot function wizard lets you select the columns you want to keep, the one column you want to pivot, and the column of values to use. You can also select the aggregation to use when combining rows in the summary.
One option allows you to ignore upper and lower case difference when combining rows of similar values. Another option will ignore blank or empty values in the pivoted column, so you don’t end up with a column with no name.
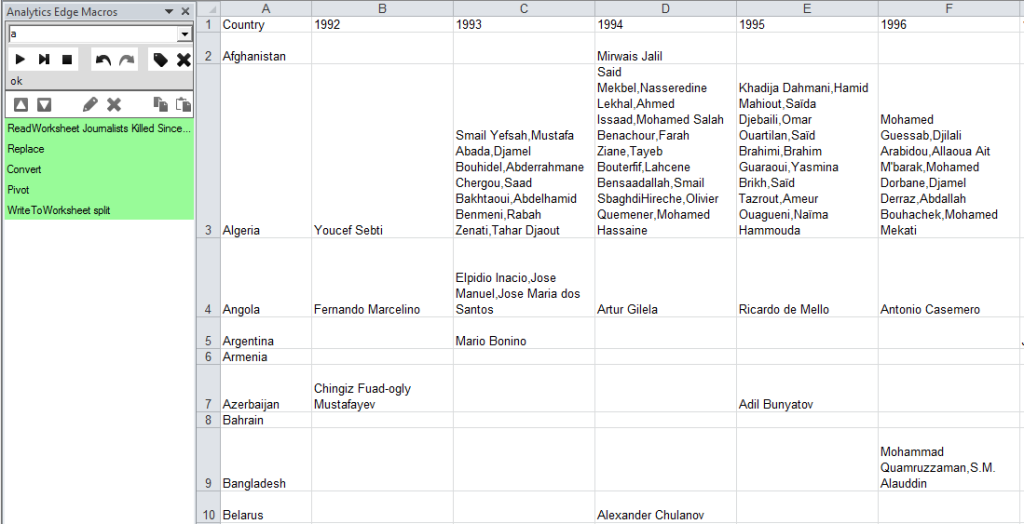
Depending on the type of column you select to use for the Cell Values, the aggregations will align. Unlike Excel, Analytics Edge lets you use text and date columns for the Cell Values, which opens the door to new types of reports. For example, you can use a column of names with the [All (list)] aggregation to have each cell contain a comma-separated list of names for each segment.
Improved trend reporting capabilities
 If you are pivoting a date column, the Analytics Edge pivot wizard will take you to a second panel where you can select the date range you want to display.
You start by choosing how you want the column headings to appear. Analytics Edge will write the headings to Excel as text cells, so you can represent the dates any way you want.
Date ranges and resolution
With Analytics Edge, you can set the start and end date for your report, and even fill in any dates that are missing in your data. You have tremendous flexibility to start from the earliest date in the data up to the latest date, or you can select from other options to report on a fixed or floating time period with either rolling periods or calendar periods.
Only part of an analysis
While the pivot function is a powerful analytic tool itself, it is only part of a real-world analysis. Rather than try to pack more functionality into the function like Excel does, Analytics Edge makes it easy to string a series of functions together to deliver the analysis you need, fast and simple.