Build a custom report to see how many Sessions included your top pages, and the result is confusing! Chances are you will see the number of Sessions drops sharply once you get below your primary landing pages. More
Helpful Articles (filter at right)
Misunderstood Metrics: Time on Page / Average Session Duration
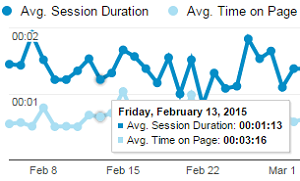 How can the Average Session Duration be less than the Average Time on Page? In Google Analytics, seeing the time spent on your website or on individual pages is not as obvious as it first appears. This Misunderstood Metrics article explores the concept of time in Google Analytics…or lost time as the case may be. More
Misunderstood Metrics: Unique Events
Google Analytics has recently changed, introducing a new Unique Events metric calculation. This article has not yet been updated to reflect that change — Mike Sullivan.
As a follow-up to my previous post on Google Analytics events, this article will look at the unique problem of “Unique Events“…the metric that defies understanding by many. More
Multi-Source Waterfall Report
The wizard-based automation provided by the Analytics Edge Core Add-in for Excel makes it easy to combine data from multiple sources. This article explores how you can build a Waterfall Report that includes data from Google Webmaster Tools (now Google Search), Bing Webmaster Tools, Google Analytics and an external database. More
Multi-View Google Analytics Queries
The Analytics Edge connector Google Analytics Pro supports multiple view queries when used in combination with The Analytics Edge Core Add-in. More
New sign-in from Internet Explorer on Windows
If you just logged into Google Analytics from the Analytics Edge connector, you may get a warning email from Google, confirming the action you just took. More
Optimize Search Engine Rankings
How do we monitor and optimize our website presence and increase our search click-through rates? More
Optional Connectors
Analytics Edge has a variety of connectors available. They can be installed, updated and uninstalled using the License wizard. When you add a paid connector, it automatically starts a 30-day free trial period. More
P25 and P75 Aggregations
 With the release of the Analytics Edge Core Add-in v10.0.6, the Combine, Duplicates, Lookup, Pivot, Subtotal and Total functions have new “P25” and “P75” aggregations options. More
Please reduce the amount of data you’re asking for
When the Facebook Ads API returns an error 500, it is usually telling you that the combination of the number of metrics and rows of data being asked for is too large for them to process all at once. You may hit the limit around 1000 rows, or it could be higher or lower depending on the number of columns you are asking for. More
Problems With A Macro? How To Get Help
If you have problems developing a macro in Analytics Edge, I am here to help [support@analyticsedge.com]. Two things will make the process faster and more effective. More
Reading Google Analytics 4 Detail From Big Query
If you have already setup Big Query linking from Google Analytics 4, here are the steps you need to get that detailed data into Excel via Analytics Edge…simplified. More
Reading Sitemaps to Get a Full Listing of Pages
When analyzing website traffic, there are times you might want a full listing of the website’s pages…even those that never get any traffic or impressions. Google Analytics and Google Search Console will only report on pages were there is data, so these unrecognized pages continue to be overlooked. This article shows how the Analytics Edge Core Add-in can read the website’s sitemap files to extract a full listing of pages. More
Recreating the Google Analytics User Explorer Report
With the [undocumented] addition of the Client ID dimension to the Google Analytics API, you can now use the Analytics Edge Core Add-in and Google Analytics Pro connector to recreate the User Explorer report in Google Analytics. More
Removing Spam Filters
Analytics Edge no longer offers a spam filter service to new clients. If you need help implementing filters in your account, I recommend Carlos Escalera’s service. More
Reporting Bounce Rate in Google Analytics 4
If you have transitioned to the new Google Analytics 4, you have probably noticed that there is no Bounce Rate metric available. Instead they push an ‘Engaged Sessions’ number, which is kind of like the opposite to a Bounce Rate. What if you really want the old metric? Well, a little math and you get your answer, but you probably won’t like it. More
Reporting Multiple Google Analytics Segments
When you want to combine two or more queries, such as multiple Google Analytics segments, the Analytics Edge Core Add-in provides the tools to automate it. More
Running Macros from Buttons
The Analytics Edge Core Add-in can run a specific Analytics Edge macro from a button on your worksheet. More
Running Macros from VBA
With Analytics Edge Core Add-in, you can run an Analytics Edge macro (e.g. “MyMacro”) from Visual Basic for Applications (VBA), using code More
Running Queries from Buttons
With the Analytics Edge Core Add-in, it is now possible to run a specific Analytics Edge query from a button on your worksheet (the Analytics Edge Core Add-in must be installed). More
Selecting a Date Range
In most Analytics Edge wizards, you can select a data range for your query. There are a large number of combinations possible, but here are the most common selections. More
Sending Excel Reports To Clients
Many analysts, consultants and agencies use Excel to create reports for their clients because it allows them to deliver a unique solution, tailored to the client’s needs. By using Analytics Edge to generate and automate the report refresh, the monthly process becomes a lot easier and doesn’t require any changes to the client’s environment. More
Simple Google Search Console Query
See how quickly (20 seconds) you can get your Google Search Console data into Microsoft Excel using Analytics Edge products. (video 1:01) More
Simplified Core Web Vitals Reporting
Google released new guidance on how to collect and report Core Web Vitals using Google Analytics 4, but the approach makes use of some pretty complicated concepts with BigQuery. In this article, I want to show you how to make similar reports in Excel using Analytics Edge with a lot less work and complexity. More
Spam in Google Analytics?
Yes, the popularity of Google Analytics has gotten to the point that it has become a popular target for spammer. More
Spam-Free Reporting With Dynamic Segments
Google Analytics has had a bit of a referral spam problem over the past year, and although you can install filters in your account to prevent most of it (see the Definitive Guide to Removing GA Spam), you can’t apply them retroactively. More
Splitting a Column Into Multiple Rows
It may sound like a simple request, but splitting a column into rows is something you can’t do in Microsoft Excel without resorting to Visual Basic programming or using an add-in, like the Analytics Edge Core Add-in. More
Story: Computers Should Automate Tedious Tasks
Do you find yourself becoming a slave to the computer? That is not how it is supposed to be. This is the first of a new series of articles where I share some of my life lessons; I hope you enjoy and benefit from them. More
Terminology
The Analytics Edge Core Add-in uses some common Microsoft Excel terminology, but the meanings are slightly different. More
The Hidden Value of Nofollow Blog Comments
When I was working on a new Excel report for my Google Webmaster Tools connector, I started seeing traffic from a specific query phrase that didn’t make sense, so I dug a little deeper, and what I found made me question the very foundation of conventional SEO wisdom and the meaning behind Google Webmaster Tools data. More
Tips for Google Analytics Reporting
Analytics Edge makes it easy to get data from Google Analytics into Excel, and here are a few tips to make it easier to build impressive reports. More
Understanding Why Google Analytics 4 Is Necessary
The key to understanding the difference between Universal Analytics (previously known as Google Analytics) and Google Analytics 4 is that UA had things like a Session object, and GA 4 does not. Everything becomes so much easier to understand once you realize this fact. It also becomes clear why GA 4 is needed now. More
Unsampled Data From Google Analytics For Free
Google Analytics sampling can really mess up a custom Excel report! The Free Google Analytics Connector included with all Analytics Edge Add-ins has the ability to minimize sampling problems with large sites and long time frame queries. More
Upgrading from Basic Add-in to Core Add-in
If you have used the Analytics Edge Basic Add-in or Standard Add-in, and are moving up to the paid Analytics Edge Core Add-in, you will notice that things do not work the same way. More
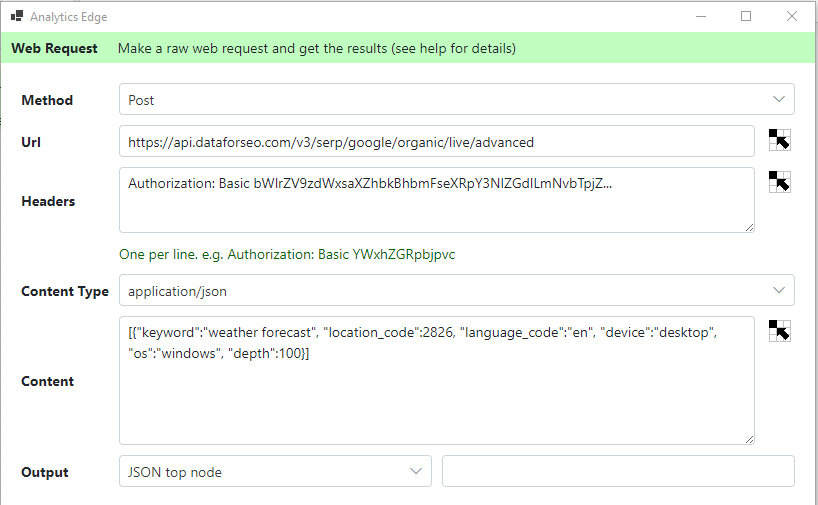
Use Web Request Function To Query DataForSEO API
This article shows how to use the Analytics Edge ‘Web Request’ function to make an API query, using the DataForSEO API as an example (a free trial of the API is avaialble). The same approach can be used for other API’s that use simple authentication schemes.
Using Append to Worksheet
The Analytics Edge Core Add-in allows you to append the results of a query to the existing data in a worksheet. While the function is simple, there are some scenarios where you can experience problems. This article describes the problems you could experience and the solutions. More
Using Excel Tables With Analytics Edge
It may not be obvious, but the Analytics Edge add-ins support the use of Excel Tables (and linked PivotTables). Not sure what an Excel Table is? Chandoo.org has a good introductory article to this powerful Excel feature. More
Using Functions in Macros
The real power of the Analytics Edge Core Add-in are the other functions that let you sort, filter or pivot your data. You can convert text to dates, and dates to first-of-the-month. More
Using Interactive Range Names
 When you use Analytics Edge in the Interactive mode, the data from the selected workbook is available for the wizard you open. For some wizards, like the new Google Search connector’s URL Inspection query, this allows you to process multiple URLs at once. More
Using the Append Function
 The Analytics Edge add-in lets you easily append data from one table to another, aligning the common columns but appending the new rows to the bottom. More
Using the Arrange Function
 The Analytics Edge add-in for Microsoft Excel lets you easily rearrange or rename columns in your report. More
Using the Combine Function
 The Analytics Edge add-in lets you easily combine data from two tables, aligning the common rows in key columns, and aggregating the cell values in other columns. More
Using the Compare Function
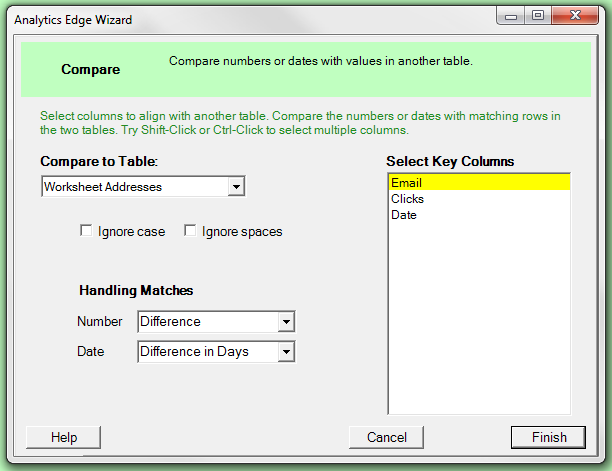 The Analytics Edge add-in lets you easily compare data from one table to another, calculating growth or change in numbers as well as time differences in dates. More
Using the Convert Function
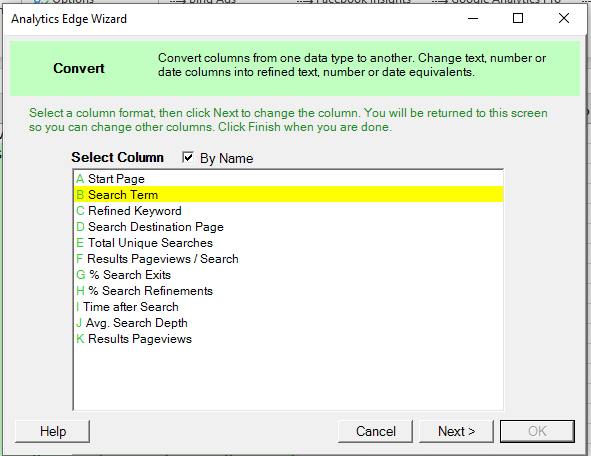 The Convert Function of the Analytics Edge Core Add-in lets you convert text, numeric and date columns in a wide variety of ways. This article describes how it can be used in your Analytics Edge macros. More
Using the Duplicates Function
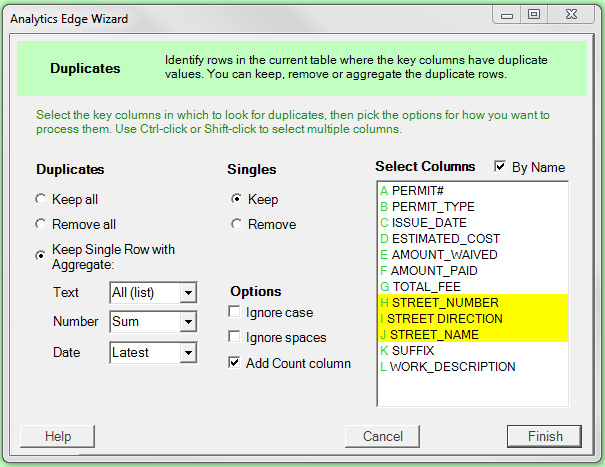 The Analytics Edge add-in for Microsoft Excel lets you easily combine rows with identical values in some of the columns. More
Using the Filter Function
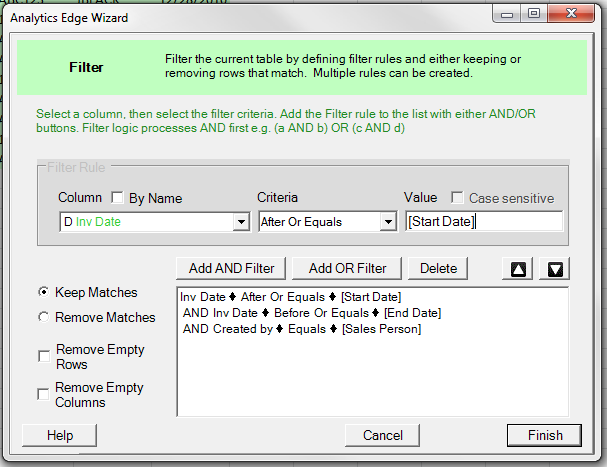 The Analytics Edge add-in for Excel lets you easily filter data in a table. More
Using the Google Analytics Pro Save Filter Function
The Google Analytics Pro connector contains a Save Filter function that lets you copy view filters from one account to a number of others with ease. More
Using the Group Function

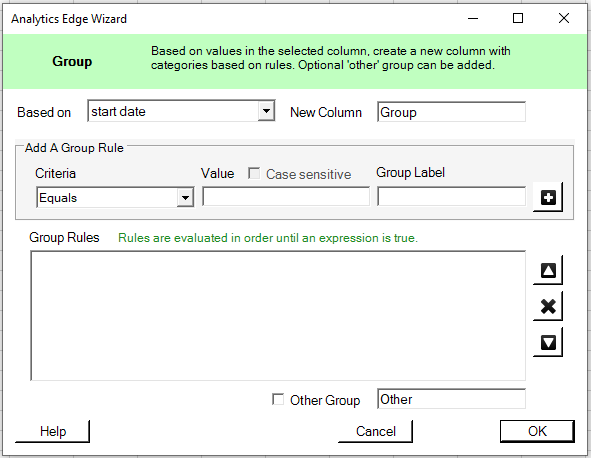 The Group function in the Analytics Edge add-in lets you easily group or categorize data. It evaluates the values (text, numbers or dates) in a selected column, and adds a new column with group or category labels. The simple wizard interface gets the job done in seconds. More
Using the Match Function
 The Analytics Edge add-in lets you keep or remove rows from one table if matching values exist in another. More
Using the Pivot Function
 The Analytics Edge add-in for Excel lets you easily pivot data without the complexity of an Excel pivot table. More
Using the Read Worksheet Function
 With the Analytics Edge add-in for Microsoft Excel, you can easily include data from existing worksheets in your automation macros. More
Using the Repeat Macro Function
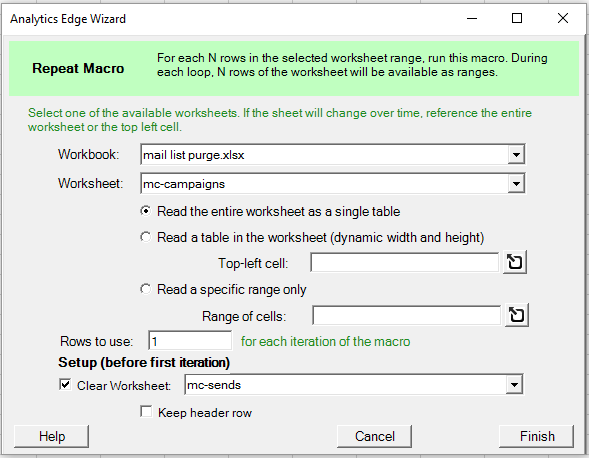 The Repeat Macro function in the Analytics Edge Core Add-in lets you cycle through a list of items. More
Using the Run Macro Function
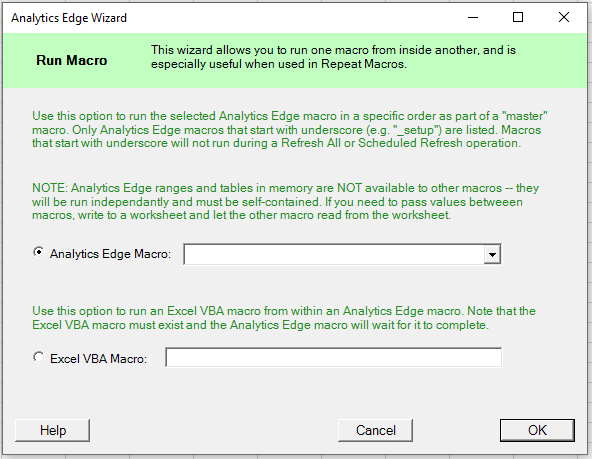 The Run Macro Function in the Analytics Edge Core Add-in lets you run other Analytics Edge macro or Excel VBA macros. This would typically be used to create a ‘master’ macro that runs through a specific sequence of other macros. With v7 of the Core Add-in, you can also trigger Excel VBA macros, which opens the door to running custom VBA code that does things Analytics Edge does not enable. More
Using the Update Function
 The Analytics Edge add-in lets you easily update one table with values from matching rows of another table. More
Using Worksheet Values to Determine Reporting Period
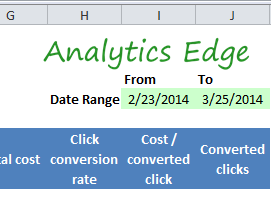 This article explores how to use date values in your Excel workbook to drive Analytics Edge connector queries, opening the door to a more interactive reporting experience within Excel. More
Using [Range Names]
Report automation goes to a whole new level when you discover [range names] in the Analytics Edge Core Add-in! This capability is embedded throughout the product, and it allows you to grab values from your data to be used in subsequent functions, like filtering one query based on the result of another query. More
Why You Should Not Use the Referral Exclusion List for Spam
While all of us fight to get Google Analytics referral spam under control, one piece of well-intentioned, but bad advice comes up over and over again: use the Referral Exclusion List. Some people (myself included) have stated that is a bad idea, but no one has taken the time to really explain why. Here is the Why… More
Write the Results into Excel
The Analytics Edge Core Add-in is holding your query results in memory, where you can easily manipulate it with other Analytics Edge functions. When you are ready, you will want to write the results into an Excel worksheet. More
Year-Over-Year Comparison in One Query
Here’s a neat little technique you can use to get year-over-year comparisons in one query with the Google Analytics Pro connector from Analytics Edge. More
Year-Over-Year Reporting
If you are trying to build a Google Analytics report comparing one year to the previous one, you can use the Pivot operation to make charting easier. The trick is to choose your dimensions wisely. More