With version 4.0 of the Analytics Edge Google Search connector, you can quickly create SEO analysis reports with tremendous insight potential; way beyond what you can do in Google Search Console itself! Here’s a quick example made in conjunction with the Analytics Edge Core Add-in.
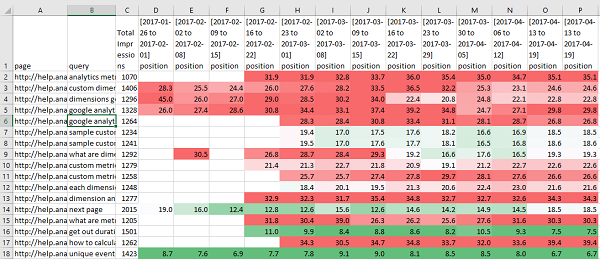
Average Positions Trend for Top Page-Query Combinations
There are some search queries that bring lots of traffic to various pages on your site, and this quick report lets you see if any of them start to climb or drop in the rankings. Use it to gauge the success of your SEO efforts, or to easily see the impact of new search ranking algorithms.
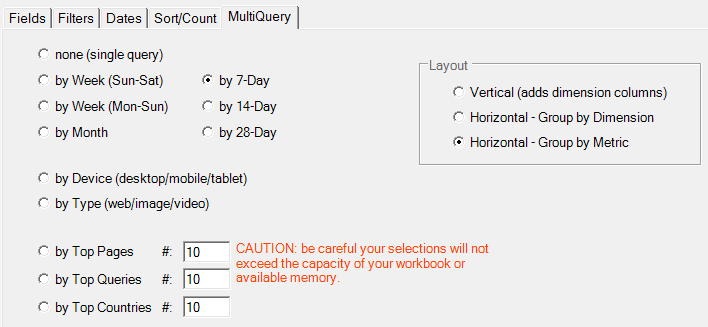
The report starts with a quick “multi-query” using the Google Search connector. Select the dimensions ‘page‘ and ‘query‘, plus the metrics ‘position‘ and ‘impressions‘. Select the preset date range of ‘Last 90 days‘, and a MultiQuery ‘by 7-Day‘ with a ‘Horizontal – Group by Metric‘ layout.
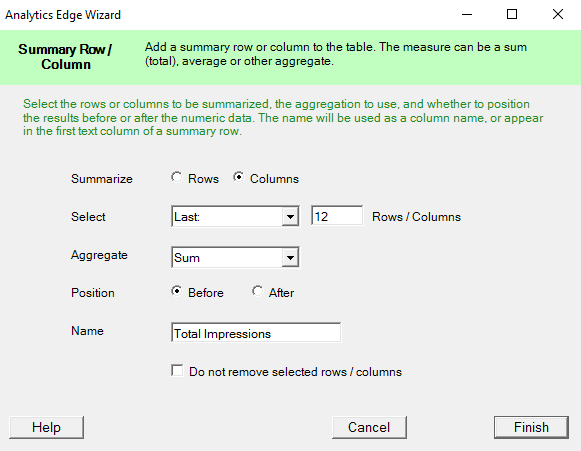
You will end up with a lot of combinations, many of which get very few impressions, so we will want to filter them. Because we have 12 weekly columns of data, it would help to get a total for the whole 12 weeks first. This is easily accomplished with the Core Add-in’s Table>Total function, summing the last 12 columns. I chose to put the column before any of the others and to remove the weekly impressions columns themselves since they don’t add much to the report.
Once we have the Total Impressions column, it is a simple matter to use a Filter function with an appropriate number (will vary depending on your website traffic – I used 1000 in this example).
Then a Write to Worksheet function finishes off the macro and your report is done! Refresh the report weekly for the latest insights!
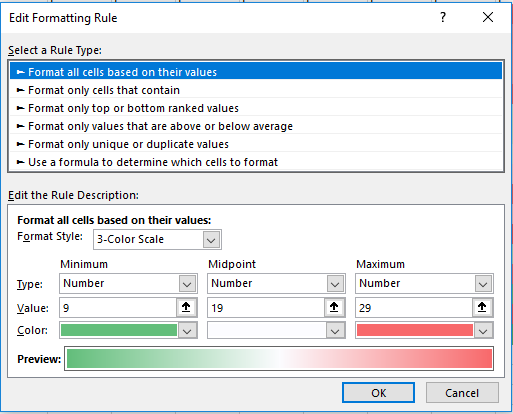
As a final step, I tend to use Excel’s custom formatting for visualization of trends. Since we are looking at search engine rankings, page 1 and 2 are where your focus needs to be, so I use a reverse 3-color rule, with red for higher numbers and green for smaller ones. I edit the rule and change the defaults so numbers 9 and lower are green (page 1 search results), numbers 19 and lower are white (page 2 search results), and numbers over 29 are red (page 3 results will shade to red). You can adjust the numbers to your preferences.
The final result now clearly shows page-query combinations that are improving or degrading in rankings, plus it makes new ‘hot’ pages very visible. If you sort the report by page, you can see how new search terms are picking up existing pages and supporting or replacing older terms.
Variations
Track a specific list of page-query combinations. Create a second worksheet of the 2 columns with the desired values, then instead of Filtering, use the Match function to keep matching values from your reference worksheet.
Highlight hot content and queries. Instead of filtering by the total impressions, use Total to get a sum of the last 4 weeks (do not remove the selected columns), then use Total again to get the sum of the last 12 weeks. Now use Calculate to create a new column with the ratio (4 week total/12 week total) and filter on the result. Filter on the Total Impressions to remove the really long tail searches… Hot combinations would have a decent number of impressions and a high ratio.